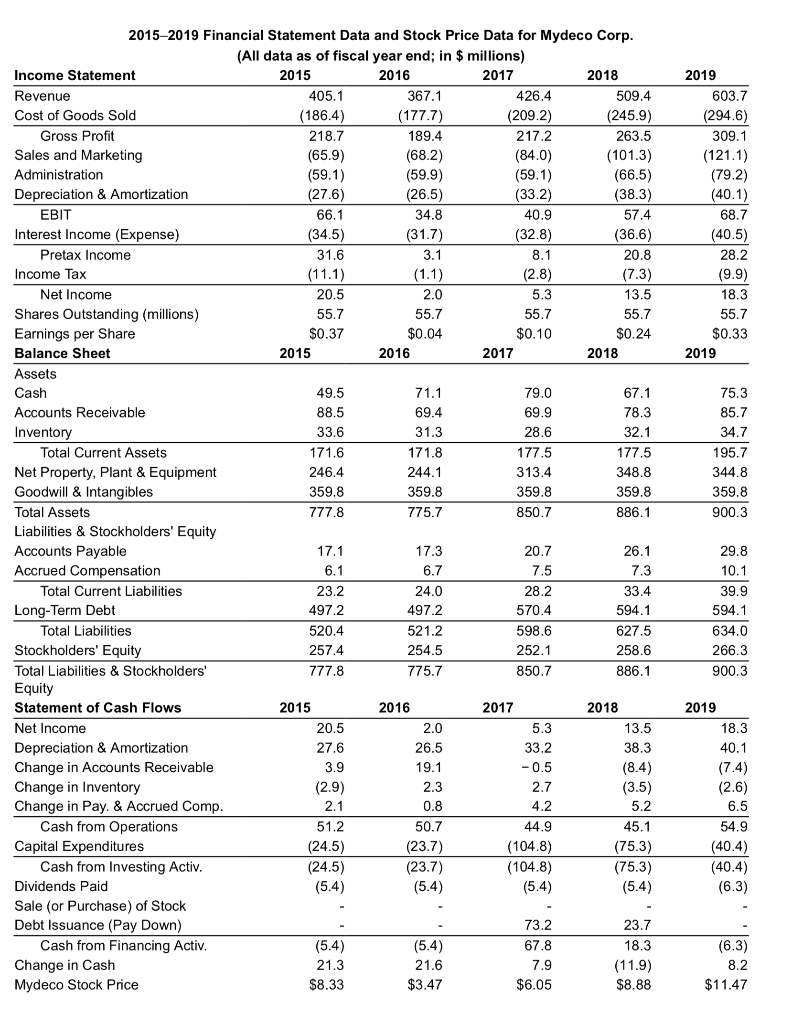
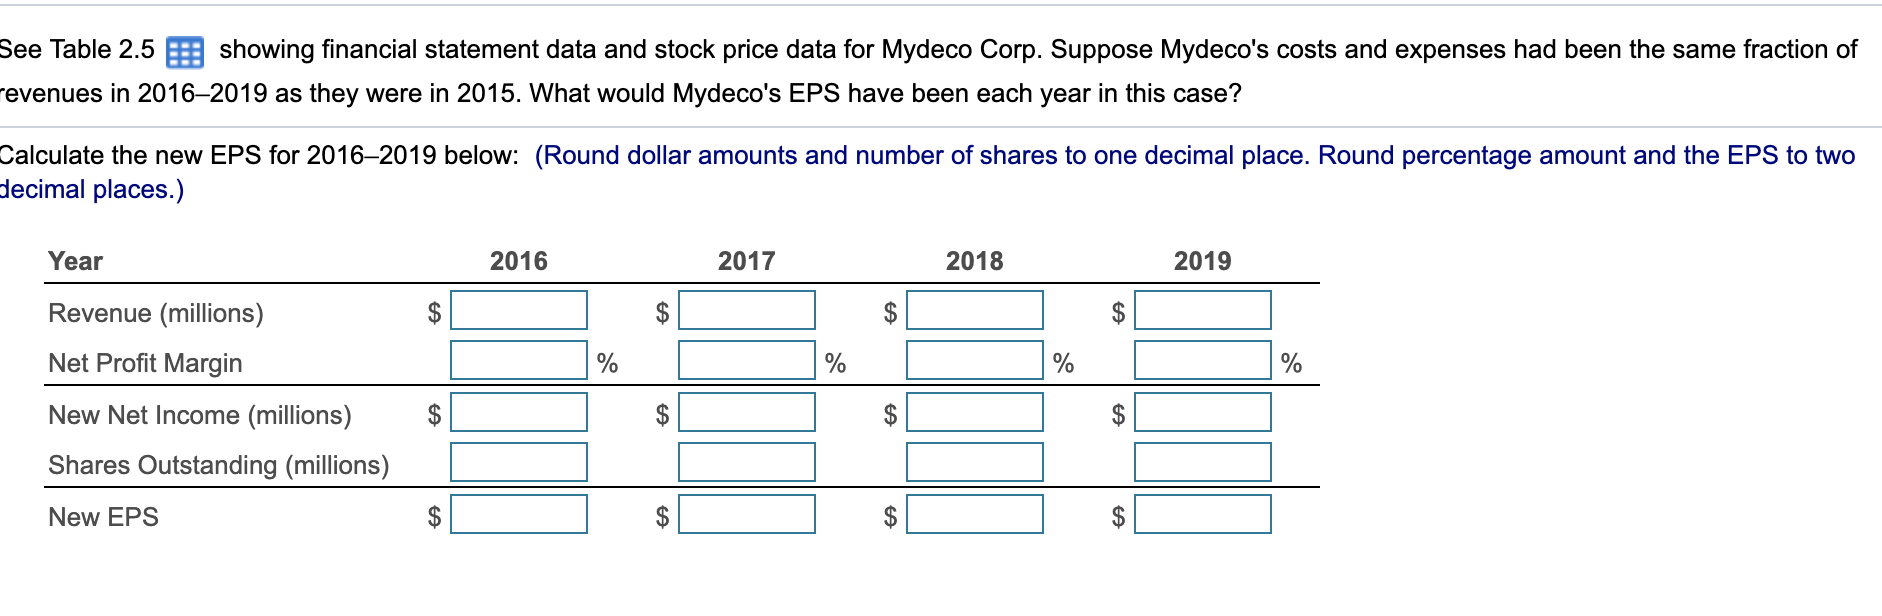
2019 603.7 (294.6) 309.1 (121.1) (79.2) (40.1) 68.7 (40.5) 28.2 (9.9) 18.3 55.7 $0.33 2019 2015-2019 Financial Statement Data and Stock Price Data for Mydeco Corp. (All data as of fiscal year end; in $ millions) Income Statement 2015 2016 2017 2018 Revenue 405.1 367.1 426.4 509.4 Cost of Goods Sold (186.4) (177.7) (209.2) (245.9) Gross Profit 218.7 189.4 217.2 263.5 Sales and Marketing (65.9) (68.2) (84.0) (101.3) Administration (59.1) (59.9) (59.1) (66.5) Depreciation & Amortization (27.6) (26.5) (33.2) (38.3) EBIT 66.1 34.8 40.9 57.4 Interest Income (Expense) (34.5) (31.7) (32.8) (36.6) Pretax Income 31.6 3.1 8.1 20.8 Income Tax (11.1) (1.1) (2.8) (7.3) Net Income 20.5 2.0 5.3 13.5 Shares Outstanding (millions) 55.7 55.7 55.7 55.7 Earnings per Share $0.37 $0.04 $0.10 $0.24 Balance Sheet 2015 2016 2017 2018 Assets Cash 49.5 71.1 79.0 67.1 Accounts Receivable 88.5 69.4 69.9 78.3 Inventory 33.6 31.3 28.6 32.1 Total Current Assets 171.6 171.8 177.5 177.5 Net Property, Plant & Equipment 246.4 244.1 313.4 348.8 Goodwill & Intangibles 359.8 359.8 359.8 359.8 Total Assets 777.8 775.7 850.7 886.1 Liabilities & Stockholders' Equity Accounts Payable 17.3 20.7 26.1 Accrued Compensation 6.1 6.7 7.5 7.3 Total Current Liabilities 23.2 24.0 28.2 33.4 Long-Term Debt 497.2 497.2 570.4 594.1 Total Liabilities 520.4 521.2 598.6 627.5 Stockholders' Equity 257.4 254.5 252.1 258.6 Total Liabilities & Stockholders' 777.8 850.7 886.1 Equity Statement of Cash Flows 2015 2016 2017 2018 Net Income 20.5 2.0 5.3 13.5 Depreciation & Amortization 27.6 26.5 33.2 38.3 Change in Accounts Receivable 3.9 19.1 -0.5 (8.4) Change in Inventory (2.9) 2.3 2.7 (3.5) Change in Pay. & Accrued Comp. 2.1 0.8 4.2 Cash from Operations 51.2 50.7 44.9 45.1 Capital Expenditures (24.5) (23.7) (104.8) (75.3) Cash from Investing Activ. (24.5) (23.7) (104.8) (75.3) Dividends Paid (5.4) (5.4) (5.4) (5.4) Sale (or Purchase) of Stock Debt Issuance (Pay Down) 73.2 23.7 Cash from Financing Activ. (5.4) (5.4) 67.8 18.3 Change in Cash 21.6 7.9 (11.9) Mydeco Stock Price $8.33 $3.47 $6.05 $8.88 75.3 85.7 34.7 195.7 344.8 359.8 900.3 17.1 29.8 10.1 39.9 594.1 634.0 266.3 900.3 775.7 2019 18.3 40.1 (7.4) (2.6) 6.5 54.9 (40.4) (40.4) 5.2 (6.3) (6.3) 21.3 8.2 $11.47 See Table 2.5 5 showing financial statement data and stock price data for Mydeco Corp. Suppose Mydeco's costs and expenses had been the same fraction of revenues in 2016-2019 as they were in 2015. What would Mydeco's EPS have been each year in this case? Calculate the new EPS for 2016-2019 below: (Round dollar amounts and number of shares to one decimal place. Round percentage amount and the EPS to two decimal places.) Year 2016 2017 2018 2019 Revenue (millions) Net Profit Margin New Net Income (millions) Shares Outstanding (millions) $L | New EPS