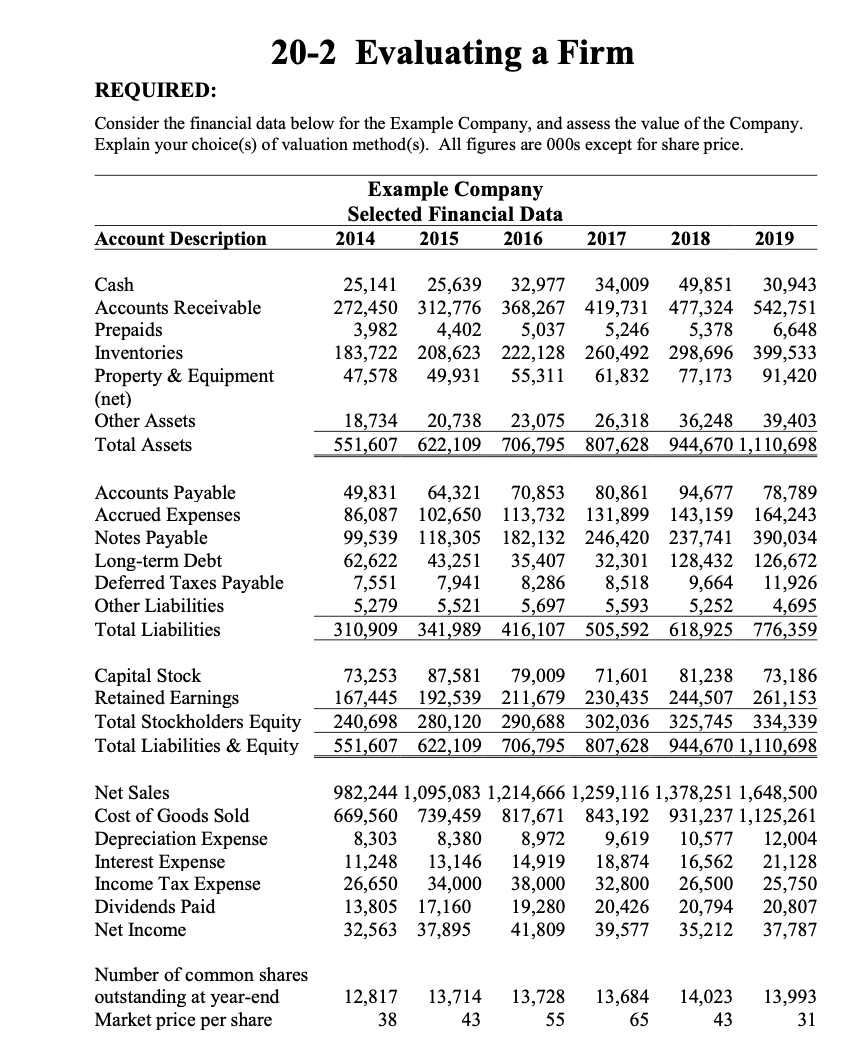
20-2 Evaluating a Firm REQUIRED: Consider the financial data below for the Example Company, and assess the value of the Company. Explain your choice(s) of valuation method(s). All figures are 000s except for share price. Example Company Selected Financial Data 2014 2015 2016 Account Description 2017 2018 2019 Cash Accounts Receivable Prepaids Inventories Property & Equipment (net) Other Assets Total Assets 25,141 25,639 32,977 34,009 49,851 30,943 272,450 312,776 368,267 419,731 477,324 542,751 3,982 4,402 5,037 5,246 5,378 6,648 183,722 208,623 222,128 260,492 298,696 399,533 47,578 49,931 55,311 61,832 77,173 91,420 18,734 20,738 23,075 26,318 36,248 39,403 551,607 622,109 706,795 807,628 944,670 1,110,698 Accounts Payable Accrued Expenses Notes Payable Long-term Debt Deferred Taxes Payable Other Liabilities Total Liabilities 49,831 64,321 70,853 80,861 94,677 78,789 86,087 102,650 113,732 131,899 143,159 164,243 99,539 118,305 182,132 246,420 237,741 390,034 62,622 43,251 35,407 32,301 128,432 126,672 7,551 7,941 8,286 8,518 9,664 11,926 5,279 5,521 5,697 5,593 5,252 4,695 310,909 341,989 416,107 505,592 618,925 776,359 Capital Stock Retained Earnings Total Stockholders Equity Total Liabilities & Equity 73,253 87,581 79,009 71,601 81,238 73,186 167,445 192,539 211,679 230,435 244,507 261,153 240,698 280,120 290,688 302,036 325,745 334,339 551,607 622,109 706,795 807,628 944,670 1,110,698 Net Sales Cost of Goods Sold Depreciation Expense Interest Expense Income Tax Expense Dividends Paid Net Income 982,244 1,095,083 1,214,666 1,259,116 1,378,251 1,648,500 669,560 739,459 817,671 843,192 931,237 1,125,261 8,303 8,380 8,972 9,619 10,577 12,004 11,248 13,146 14,919 18,874 16,562 21,128 26,650 34,000 38,000 32,800 26,500 25,750 13,805 17,160 19,280 20,426 20,794 20,807 32,563 37,895 41,809 39,577 35,212 37,787 Number of common shares outstanding at year-end Market price per share 12,817 38 13,714 43 13,728 55 13,684 65 14,023 43 13,993 31 20-2 Evaluating a Firm REQUIRED: Consider the financial data below for the Example Company, and assess the value of the Company. Explain your choice(s) of valuation method(s). All figures are 000s except for share price. Example Company Selected Financial Data 2014 2015 2016 Account Description 2017 2018 2019 Cash Accounts Receivable Prepaids Inventories Property & Equipment (net) Other Assets Total Assets 25,141 25,639 32,977 34,009 49,851 30,943 272,450 312,776 368,267 419,731 477,324 542,751 3,982 4,402 5,037 5,246 5,378 6,648 183,722 208,623 222,128 260,492 298,696 399,533 47,578 49,931 55,311 61,832 77,173 91,420 18,734 20,738 23,075 26,318 36,248 39,403 551,607 622,109 706,795 807,628 944,670 1,110,698 Accounts Payable Accrued Expenses Notes Payable Long-term Debt Deferred Taxes Payable Other Liabilities Total Liabilities 49,831 64,321 70,853 80,861 94,677 78,789 86,087 102,650 113,732 131,899 143,159 164,243 99,539 118,305 182,132 246,420 237,741 390,034 62,622 43,251 35,407 32,301 128,432 126,672 7,551 7,941 8,286 8,518 9,664 11,926 5,279 5,521 5,697 5,593 5,252 4,695 310,909 341,989 416,107 505,592 618,925 776,359 Capital Stock Retained Earnings Total Stockholders Equity Total Liabilities & Equity 73,253 87,581 79,009 71,601 81,238 73,186 167,445 192,539 211,679 230,435 244,507 261,153 240,698 280,120 290,688 302,036 325,745 334,339 551,607 622,109 706,795 807,628 944,670 1,110,698 Net Sales Cost of Goods Sold Depreciation Expense Interest Expense Income Tax Expense Dividends Paid Net Income 982,244 1,095,083 1,214,666 1,259,116 1,378,251 1,648,500 669,560 739,459 817,671 843,192 931,237 1,125,261 8,303 8,380 8,972 9,619 10,577 12,004 11,248 13,146 14,919 18,874 16,562 21,128 26,650 34,000 38,000 32,800 26,500 25,750 13,805 17,160 19,280 20,426 20,794 20,807 32,563 37,895 41,809 39,577 35,212 37,787 Number of common shares outstanding at year-end Market price per share 12,817 38 13,714 43 13,728 55 13,684 65 14,023 43 13,993 31