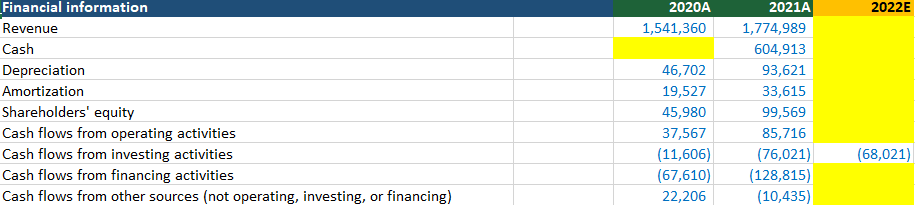
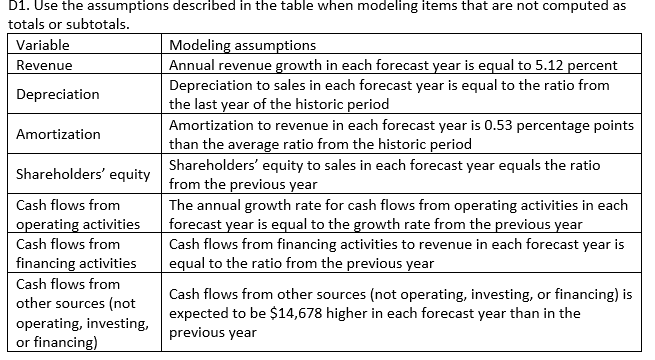
2022E 2020A 1,541,360 Financial information Revenue Cash Depreciation Amortization Shareholders' equity Cash flows from operating activities Cash flows from investing activities Cash flows from financing activities Cash flows from other sources (not operating, investing, or financing) 46,702 19,527 45,980 37,567 (11,606) (67,610) 22,206 2021A 1,774,989 604,913 93,621 33,615 99,569 85,716 (76,021) (128,815) (10,435) (68,021) D1. Use the assumptions described in the table when modeling items that are not computed as totals or subtotals. Variable Modeling assumptions Revenue Annual revenue growth in each forecast year is equal to 5.12 percent Depreciation to sales in each forecast year is equal to the ratio from Depreciation the last year of the historic period Amortization to revenue in each forecast year is 0.53 percentage points Amortization than the average ratio from the historic period Shareholders' equity Shareholders' equity to sales in each forecast year equals the ratio from the previous year Cash flows from The annual growth rate for cash flows from operating activities in each operating activities forecast year is equal to the growth rate from the previous year Cash flows from Cash flows from financing activities to revenue in each forecast year is financing activities equal to the ratio from the previous year Cash flows from other sources (not Cash flows from other sources (not operating, investing, or financing) is expected to be $14,678 higher in each forecast year than in the operating, investing, or financing) previous year 2022E 2020A 1,541,360 Financial information Revenue Cash Depreciation Amortization Shareholders' equity Cash flows from operating activities Cash flows from investing activities Cash flows from financing activities Cash flows from other sources (not operating, investing, or financing) 46,702 19,527 45,980 37,567 (11,606) (67,610) 22,206 2021A 1,774,989 604,913 93,621 33,615 99,569 85,716 (76,021) (128,815) (10,435) (68,021) D1. Use the assumptions described in the table when modeling items that are not computed as totals or subtotals. Variable Modeling assumptions Revenue Annual revenue growth in each forecast year is equal to 5.12 percent Depreciation to sales in each forecast year is equal to the ratio from Depreciation the last year of the historic period Amortization to revenue in each forecast year is 0.53 percentage points Amortization than the average ratio from the historic period Shareholders' equity Shareholders' equity to sales in each forecast year equals the ratio from the previous year Cash flows from The annual growth rate for cash flows from operating activities in each operating activities forecast year is equal to the growth rate from the previous year Cash flows from Cash flows from financing activities to revenue in each forecast year is financing activities equal to the ratio from the previous year Cash flows from other sources (not Cash flows from other sources (not operating, investing, or financing) is expected to be $14,678 higher in each forecast year than in the operating, investing, or financing) previous year