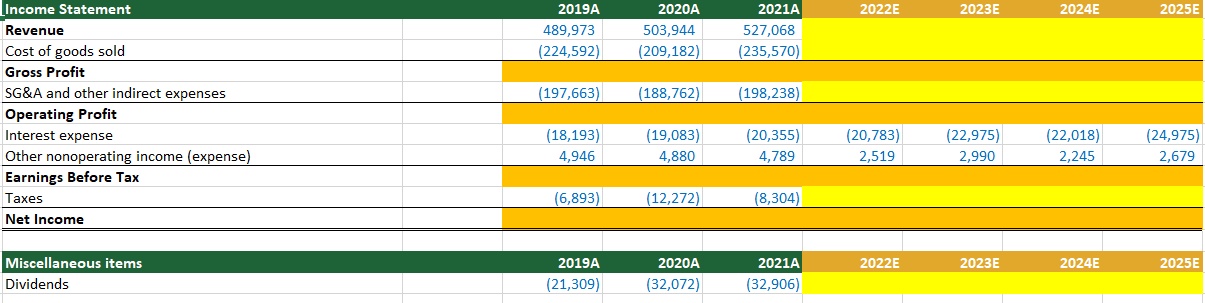
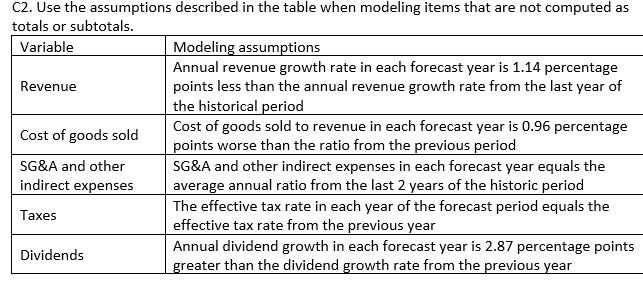
2022E 2023E 2024E 2025E 2019A 489,973 (224,592) 2020A 503,944 (209,182) 2021A 527,068 (235,570) (197,663) (188,762) (198,238) Income Statement Revenue Cost of goods sold Gross Profit SG&A and other indirect expenses Operating Profit Interest expense Other nonoperating income (expense) Earnings Before Tax Taxes Net Income (18,193) 4,946 (19,083) 4,880 (20,355) 4,789 (20,783) 2,519 (22,975) 2,990 (22,018) 2,245 (24,975) 2,679 (6,893) (12,272) (8,304) 2022E 2023E 2024E 2025E Miscellaneous items Dividends 2019A (21,309) 2020A (32,072) 2021A (32,906) C2. Use the assumptions described in the table when modeling items that are not computed as totals or subtotals. Variable Modeling assumptions Annual revenue growth rate in each forecast year is 1.14 percentage Revenue points less than the annual revenue growth rate from the last year of the historical period Cost of goods sold to revenue in each forecast year is 0.96 percentage Cost of goods sold points worse than the ratio from the previous period SG&A and other SG&A and other indirect expenses in each forecast year equals the indirect expenses average annual ratio from the last 2 years of the historic period The effective tax rate in each year of the forecast period equals the Taxes effective tax rate from the previous year Annual dividend growth in each forecast year is 2.87 percentage points Dividends greater than the dividend growth rate from the previous year 2022E 2023E 2024E 2025E 2019A 489,973 (224,592) 2020A 503,944 (209,182) 2021A 527,068 (235,570) (197,663) (188,762) (198,238) Income Statement Revenue Cost of goods sold Gross Profit SG&A and other indirect expenses Operating Profit Interest expense Other nonoperating income (expense) Earnings Before Tax Taxes Net Income (18,193) 4,946 (19,083) 4,880 (20,355) 4,789 (20,783) 2,519 (22,975) 2,990 (22,018) 2,245 (24,975) 2,679 (6,893) (12,272) (8,304) 2022E 2023E 2024E 2025E Miscellaneous items Dividends 2019A (21,309) 2020A (32,072) 2021A (32,906) C2. Use the assumptions described in the table when modeling items that are not computed as totals or subtotals. Variable Modeling assumptions Annual revenue growth rate in each forecast year is 1.14 percentage Revenue points less than the annual revenue growth rate from the last year of the historical period Cost of goods sold to revenue in each forecast year is 0.96 percentage Cost of goods sold points worse than the ratio from the previous period SG&A and other SG&A and other indirect expenses in each forecast year equals the indirect expenses average annual ratio from the last 2 years of the historic period The effective tax rate in each year of the forecast period equals the Taxes effective tax rate from the previous year Annual dividend growth in each forecast year is 2.87 percentage points Dividends greater than the dividend growth rate from the previous year