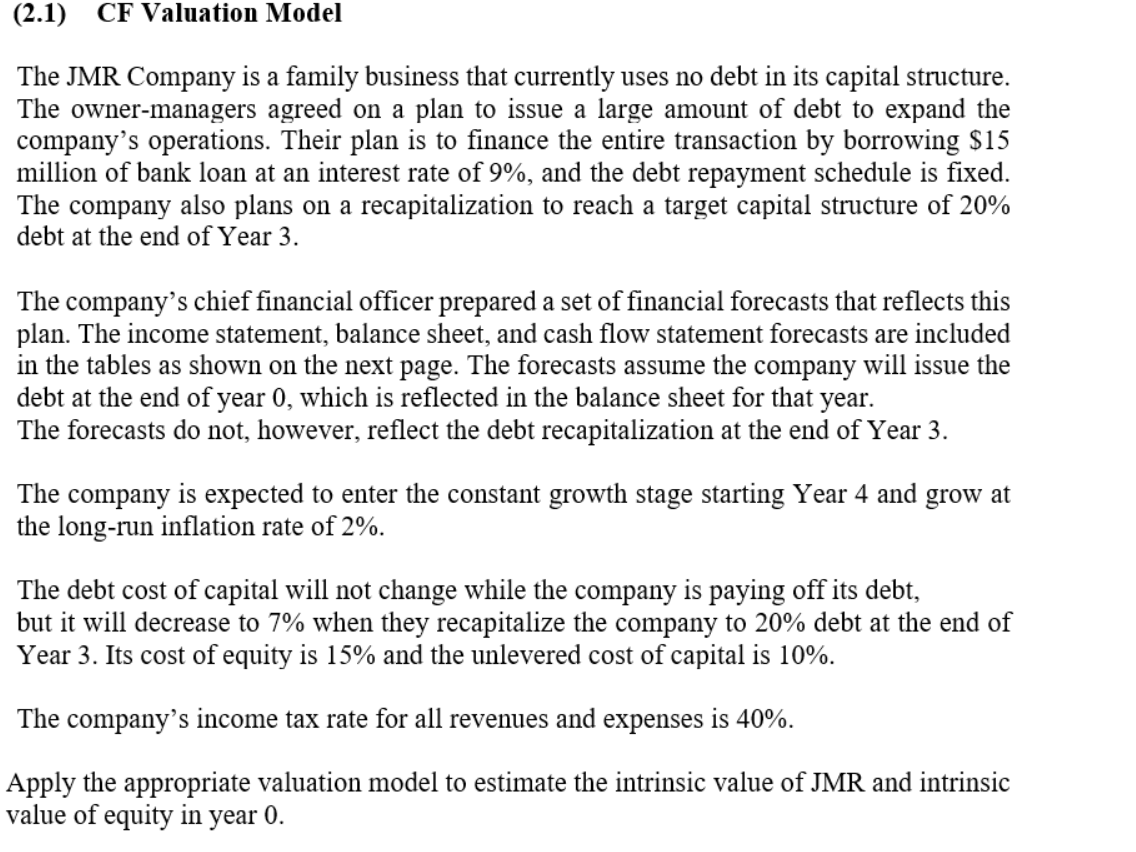
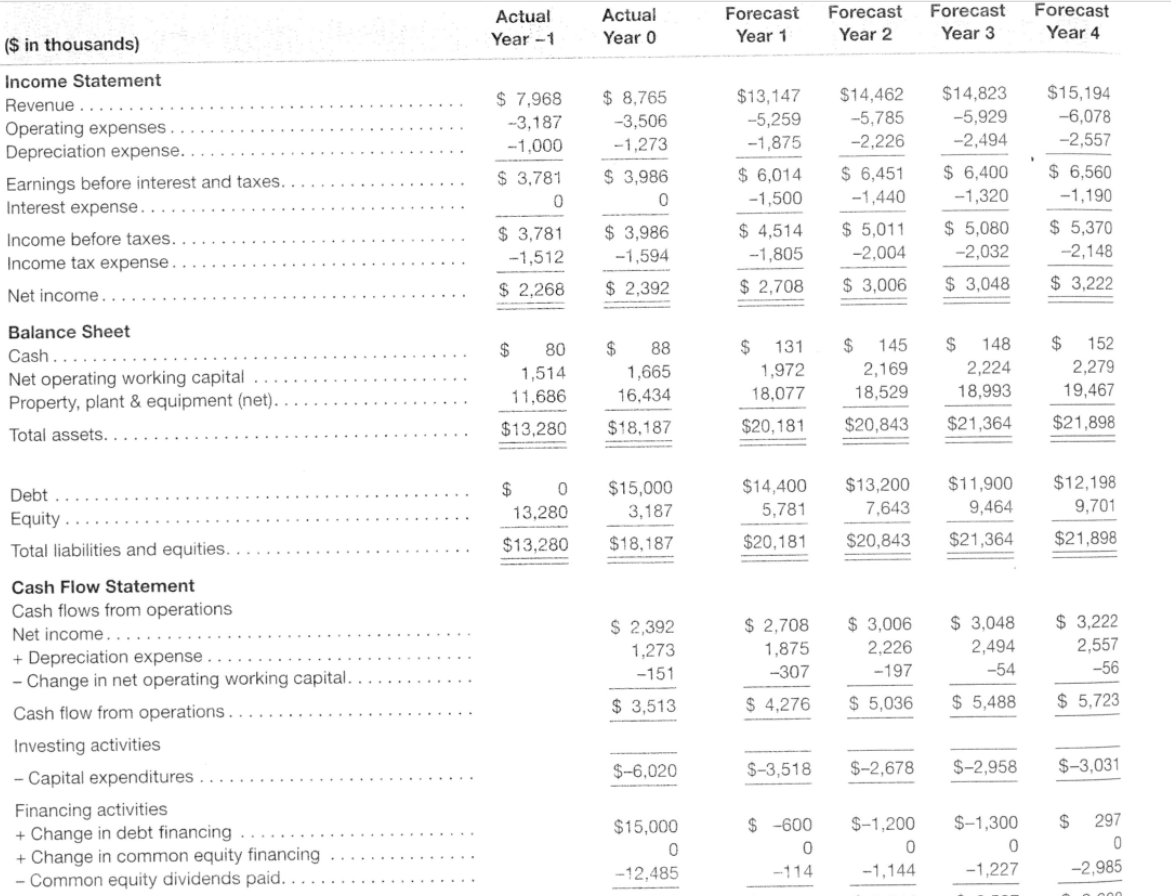
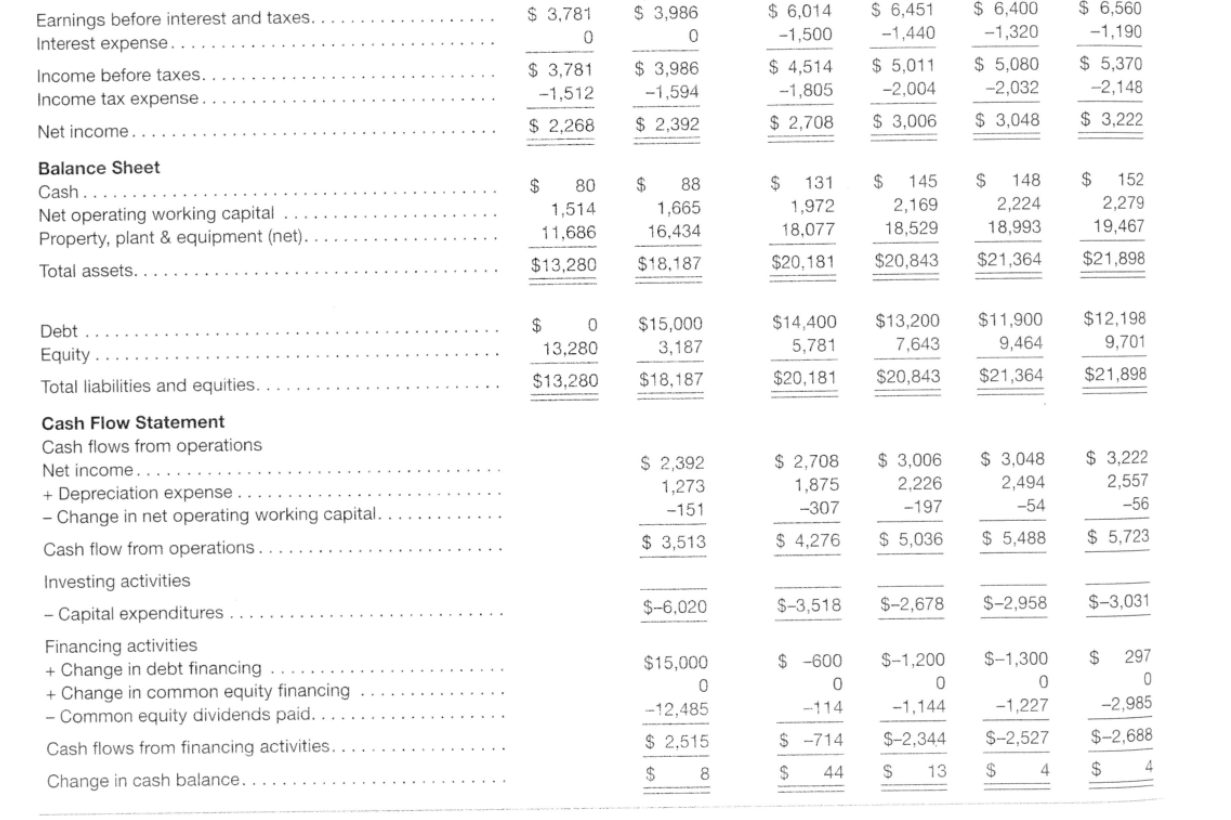
(2.1) CF Valuation Model The JMR Company is a family business that currently uses no debt in its capital structure. The owner-managers agreed on a plan to issue a large amount of debt to expand the company's operations. Their plan is to finance the entire transaction by borrowing $15 million of bank loan at an interest rate of 9%, and the debt repayment schedule is fixed. The company also plans on a recapitalization to reach a target capital structure of 20% debt at the end of Year 3. The company's chief financial officer prepared a set of financial forecasts that reflects this plan. The income statement, balance sheet, and cash flow statement forecasts are included in the tables as shown on the next page. The forecasts assume the company will issue the debt at the end of year 0, which is reflected in the balance sheet for that year. The forecasts do not, however, reflect the debt recapitalization at the end of Year 3. The company is expected to enter the constant growth stage starting Year 4 and grow at the long-run inflation rate of 2%. The debt cost of capital will not change while the company is paying off its debt, but it will decrease to 7% when they recapitalize the company to 20% debt at the end of Year 3. Its cost of equity is 15% and the unlevered cost of capital is 10%. The company's income tax rate for all revenues and expenses is 40%. Apply the appropriate valuation model to estimate the intrinsic value of JMR and intrinsic value of equity in year 0. ($ in thousands) Income Statement Revenue.. Operating expenses. Depreciation expense. Earnings before interest and taxes. Interest expense.. Income before taxes. Income tax expense. Net income.. Balance Sheet Cash.. Net operating working capital Property, plant & equipment (net). Total assets.. Debt Equity. Total liabilities and equities. Cash Flow Statement Cash flows from operations Net income.. + Depreciation expense - Change in net operating working capital. Cash flow from operations.. Investing activities - Capital expenditures.. Financing activities + Change in debt financing + Change in common equity financing - Common equity dividends paid... Actual Year 0 $8,765 -3,506 -1,273 $ 3,986 0 $ 3,986 -1,594 $ 2,392 80 $ 88 1,665 16,434 $18,187 0 $15,000 3,187 $18,187 $ 2,392 1,273 -151 $ 3,513 $-6,020 $15,000 0 -12,485 Actual Year -1 $ 7,968 -3,187 -1,000 $3,781 0 $ 3,781 -1,512 $2,268 $ 1,514 11,686 $13,280 $ 13,280 $13,280 Forecast Forecast Forecast Forecast Year 1 Year 2 Year 3 Year 4 $13,147 $14,462 $14,823 $15,194 -5,259 -5,785 -5,929 -6,078 -1,875 -2,226 -2,494 -2,557 $ 6,451 $ 6,400 $6,014 -1,500 -1,440 $ 6,560 -1,190 $ 5,370 -2,148 $4,514 -1,805 -1,320 $ 5,080 -2,032 $5,011 -2,004 $2,708 $3,006 $3,048 $3,222 $ 131 $ 145 $ 148 $ 152 1,972 2,169 2,224 2,279 18,077 18,529 18,993 19,467 $20,181 $20,843 $21,364 $21,898 $13,200 $11,900 $12,198 $14,400 5,781 7,643 9,464 9,701 $20,181 $20,843 $21,364 $21,898 $ 2,708 $3,006 $3,048 $ 3,222 2,226 2,494 2,557 1,875 -307 -197 -54 -56 $ 4,276 $ 5,036 $5,488 $5,723 $-3,518 $-2,678 $-2,958 $-3,031 $ -600 $-1,200 0 -114 0 -1,144 $-1,300 0 -1,227 $ 297 0 -2,985 0.000 Earnings before interest and taxes. Interest expense.. Income before taxes.. Income tax expense. Net income... Balance Sheet Cash... Net operating working capital Property, plant & equipment (net). Total assets.. Debt Equity Total liabilities and equities. Cash Flow Statement Cash flows from operations Net income.. + Depreciation expense.. - Change in net operating working capital. Cash flow from operations. Investing activities - Capital expenditures. Financing activities + Change in debt financing + Change in common equity financing - Common equity dividends paid. Cash flows from financing activities. Change in cash balance... $3,781 0 $3,781 -1,512 $2,268 $ 80 1,514 11,686 $13,280 $0 13,280 $13,280 $ 3,986 0 $ 3,986 -1,594 $ 2,392 $ 88 1,665 16,434 $18,187 $15,000 3,187 $18,187 $ 2,392 1,273 -151 $ 3,513 $-6,020 $15,000 0 -12,485 $2,515 $ 8 $6,014 -1,500 $4,514 -1,805 $ 2,708 $ 131 1,972 18,077 $20,181 $14,400 5,781 $20,181 $ 2,708 1,875 -307 $4,276 $-3,518 $ -600 0 -114 $-714 44 $ $ 6,451 $ 6,400 -1,320 -1,440 $5,011 -2,004 $3,006 $ 5,080 -2,032 $3,048 $ 145 $ 148 2,224 2,169 18,529 18,993 $20,843 $21,364 $13,200 $11,900 7,643 9,464 $20,843 $21,364 $3,006 $3,048 2,494 2,226 -197 -54 $ 5,036 $5,488 $-2,678 $-2,958 0 $-1,200 $-1,300 0 -1,144 $-2,344 -1,227 $-2,527 $ 4 $ 13 $6,560 -1,190 $5,370 -2,148 $3,222 $ 152 2,279 19,467 $21,898 $12,198 9,701 $21,898 $ 3,222 2,557 -56 $5,723 $-3,031 $ 297 0 -2,985 $-2,688 4 $