Answered step by step
Verified Expert Solution
Question
1 Approved Answer
2.12 LAB: Confidence and prediction intervals for MLR models The wine dataset contains 4,898 instances with 11 features that include pH, percentage of alcohol, and
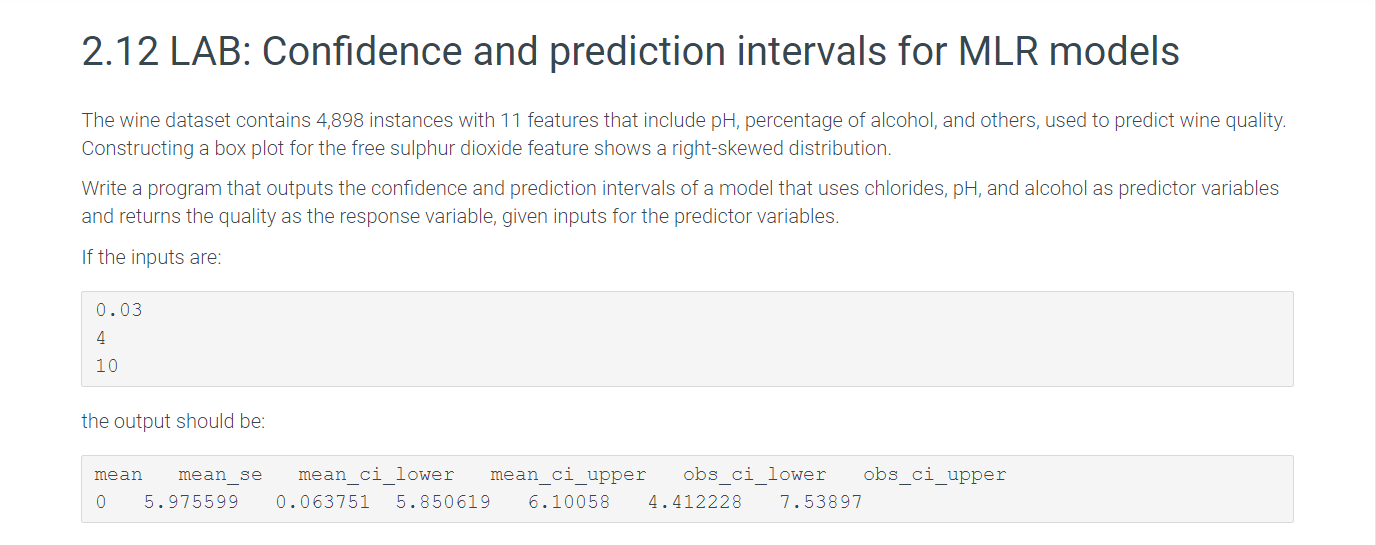
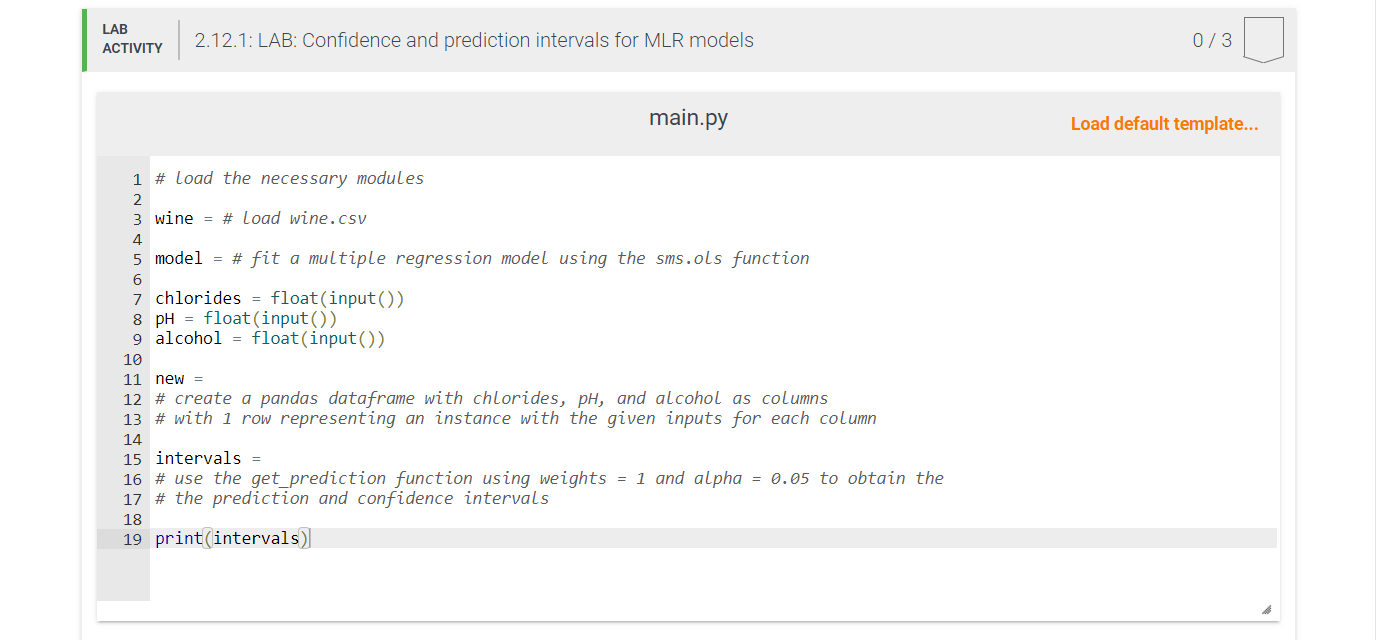
2.12 LAB: Confidence and prediction intervals for MLR models The wine dataset contains 4,898 instances with 11 features that include pH, percentage of alcohol, and others, used to predict wine quality. Constructing a box plot for the free sulphur dioxide feature shows a right-skewed distribution. Write a program that outputs the confidence and prediction intervals of a model that uses chlorides, pH, and alcohol as predictor variables and returns the quality as the response variable, given inputs for the predictor variables. If the inputs are: 0 . 03 4 10 the output should be: mean mean se mean ci lower mean ci upper obs ci lower obs ci upper 5. 975599 0. 063751 5. 850619 6. 10058 4. 412228 7. 53897LAB ACTIVITY 2.12.1: LAB: Confidence and prediction intervals for MLR models 0/3 main.py Load default template... 1 # Load the necessary modules IN 3 wine = # Load wine. csv 4 5 model = # fit a multiple regression model using the sms. ols function 6 chlorides = float(input()) 8 PH = float (input() ) 9 alcohol = float(input()) 10 11 new = 12 # create a pandas dataframe with chlorides, pH, and alcohol as columns 13 # with 1 row representing an instance with the given inputs for each column 14 15 intervals = 16 # use the get_prediction function using weights = 1 and alpha = 0.05 to obtain the 17 # the prediction and confidence intervals 18 19 print (intervals)|
Step by Step Solution
There are 3 Steps involved in it
Step: 1
Get Instant Access to Expert-Tailored Solutions
See step-by-step solutions with expert insights and AI powered tools for academic success
Step: 2
Step: 3
Ace Your Homework with AI
Get the answers you need in no time with our AI-driven, step-by-step assistance
Get Started