Answered step by step
Verified Expert Solution
Question
1 Approved Answer
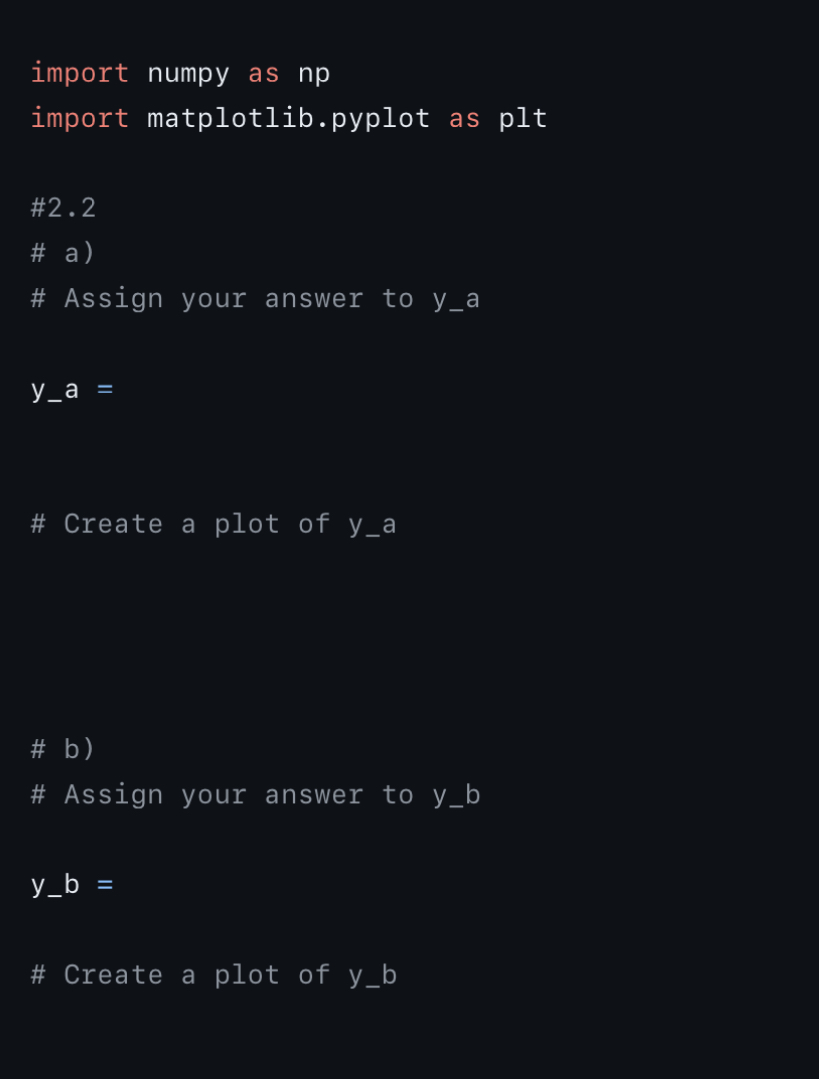
2.2 Create program statements in Python that compute a vector of y values based on the following formulas: 613 - 3t - 4 (a) y=
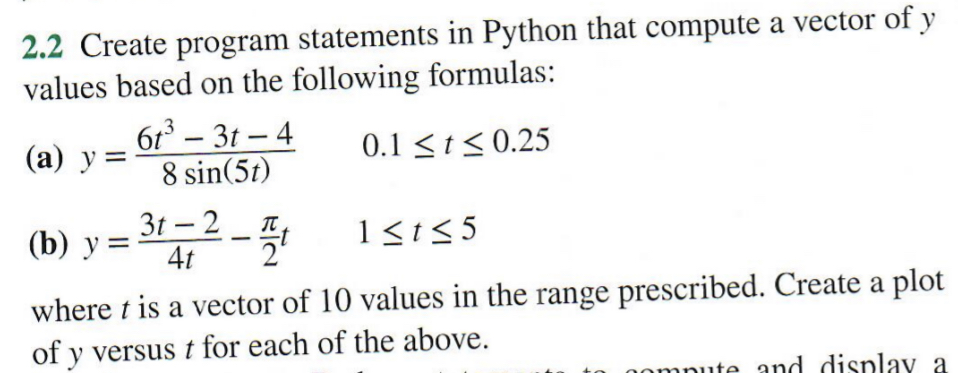
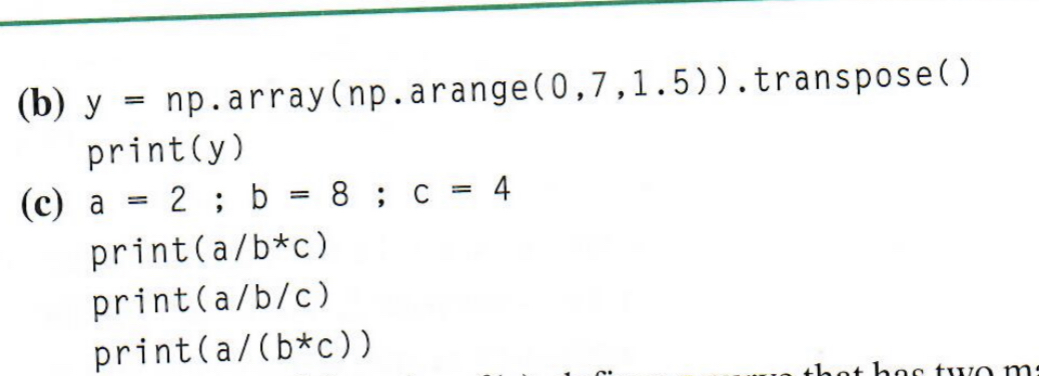
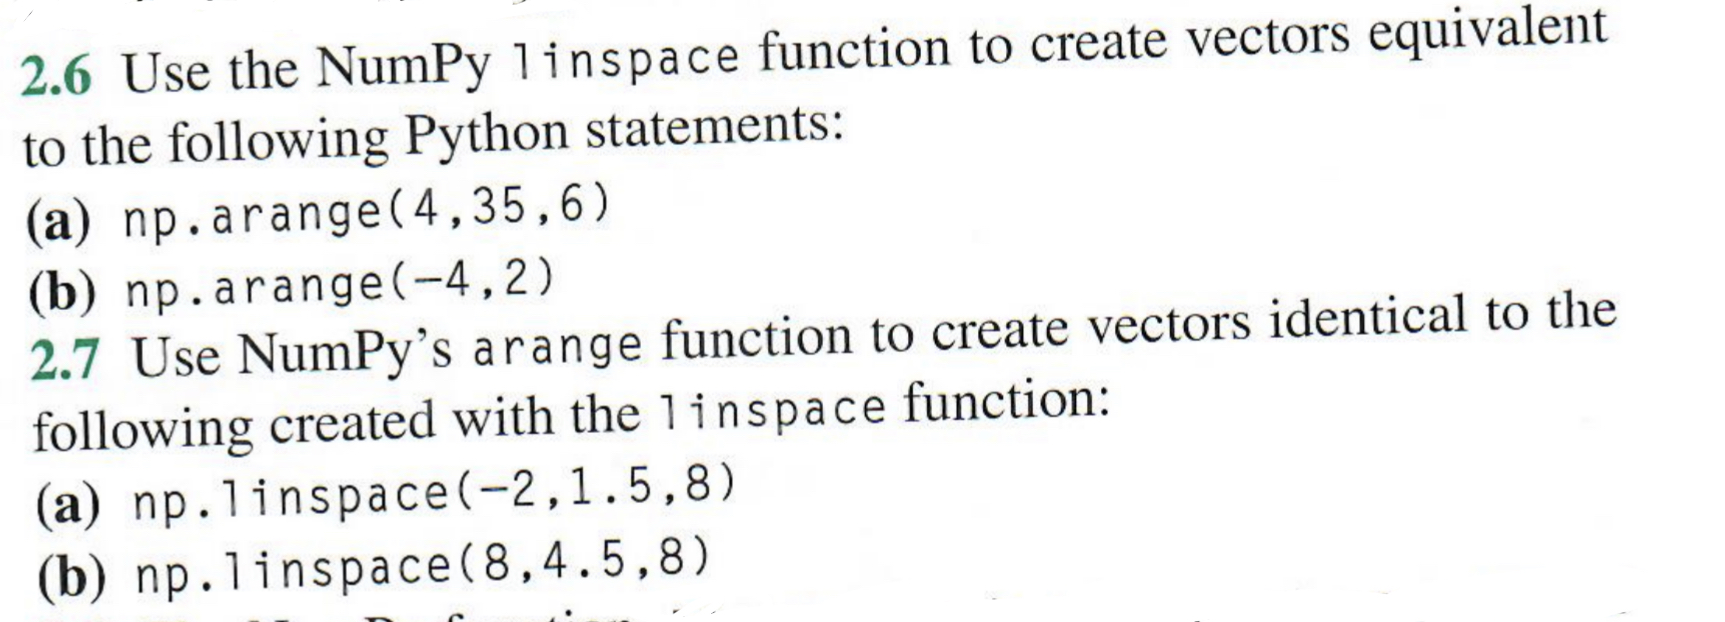
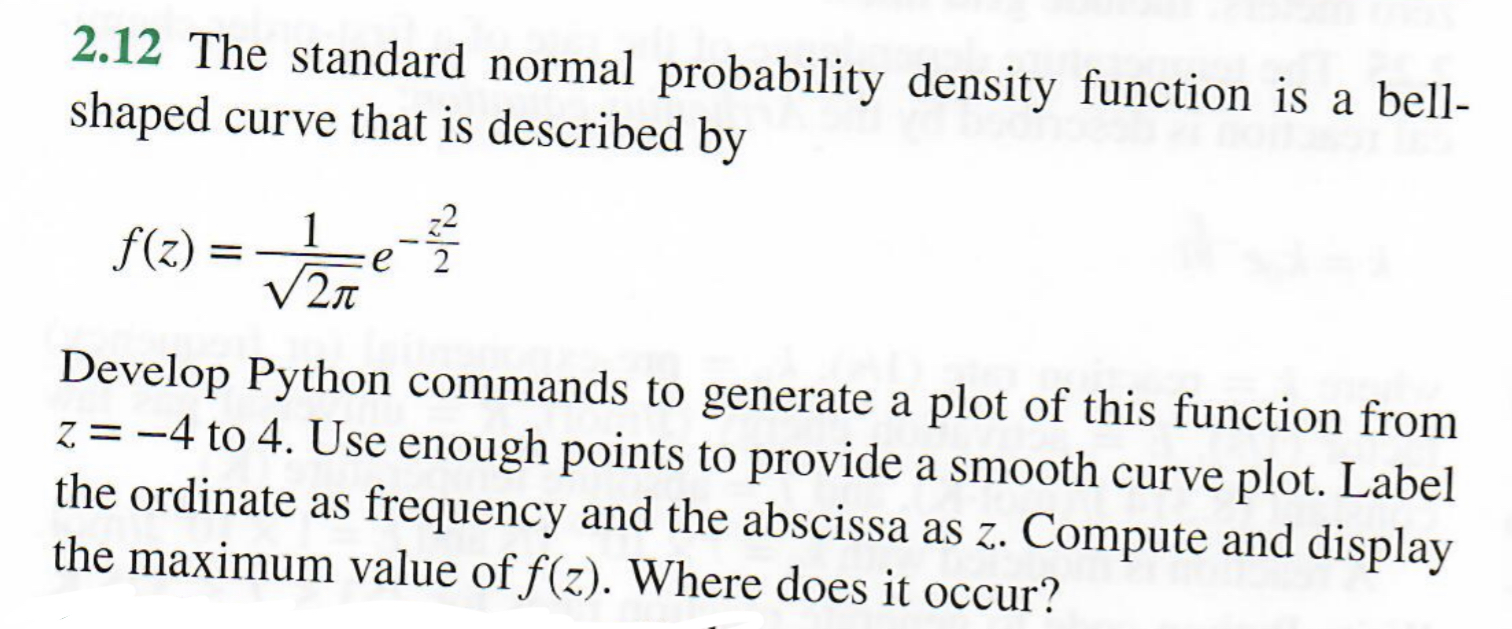
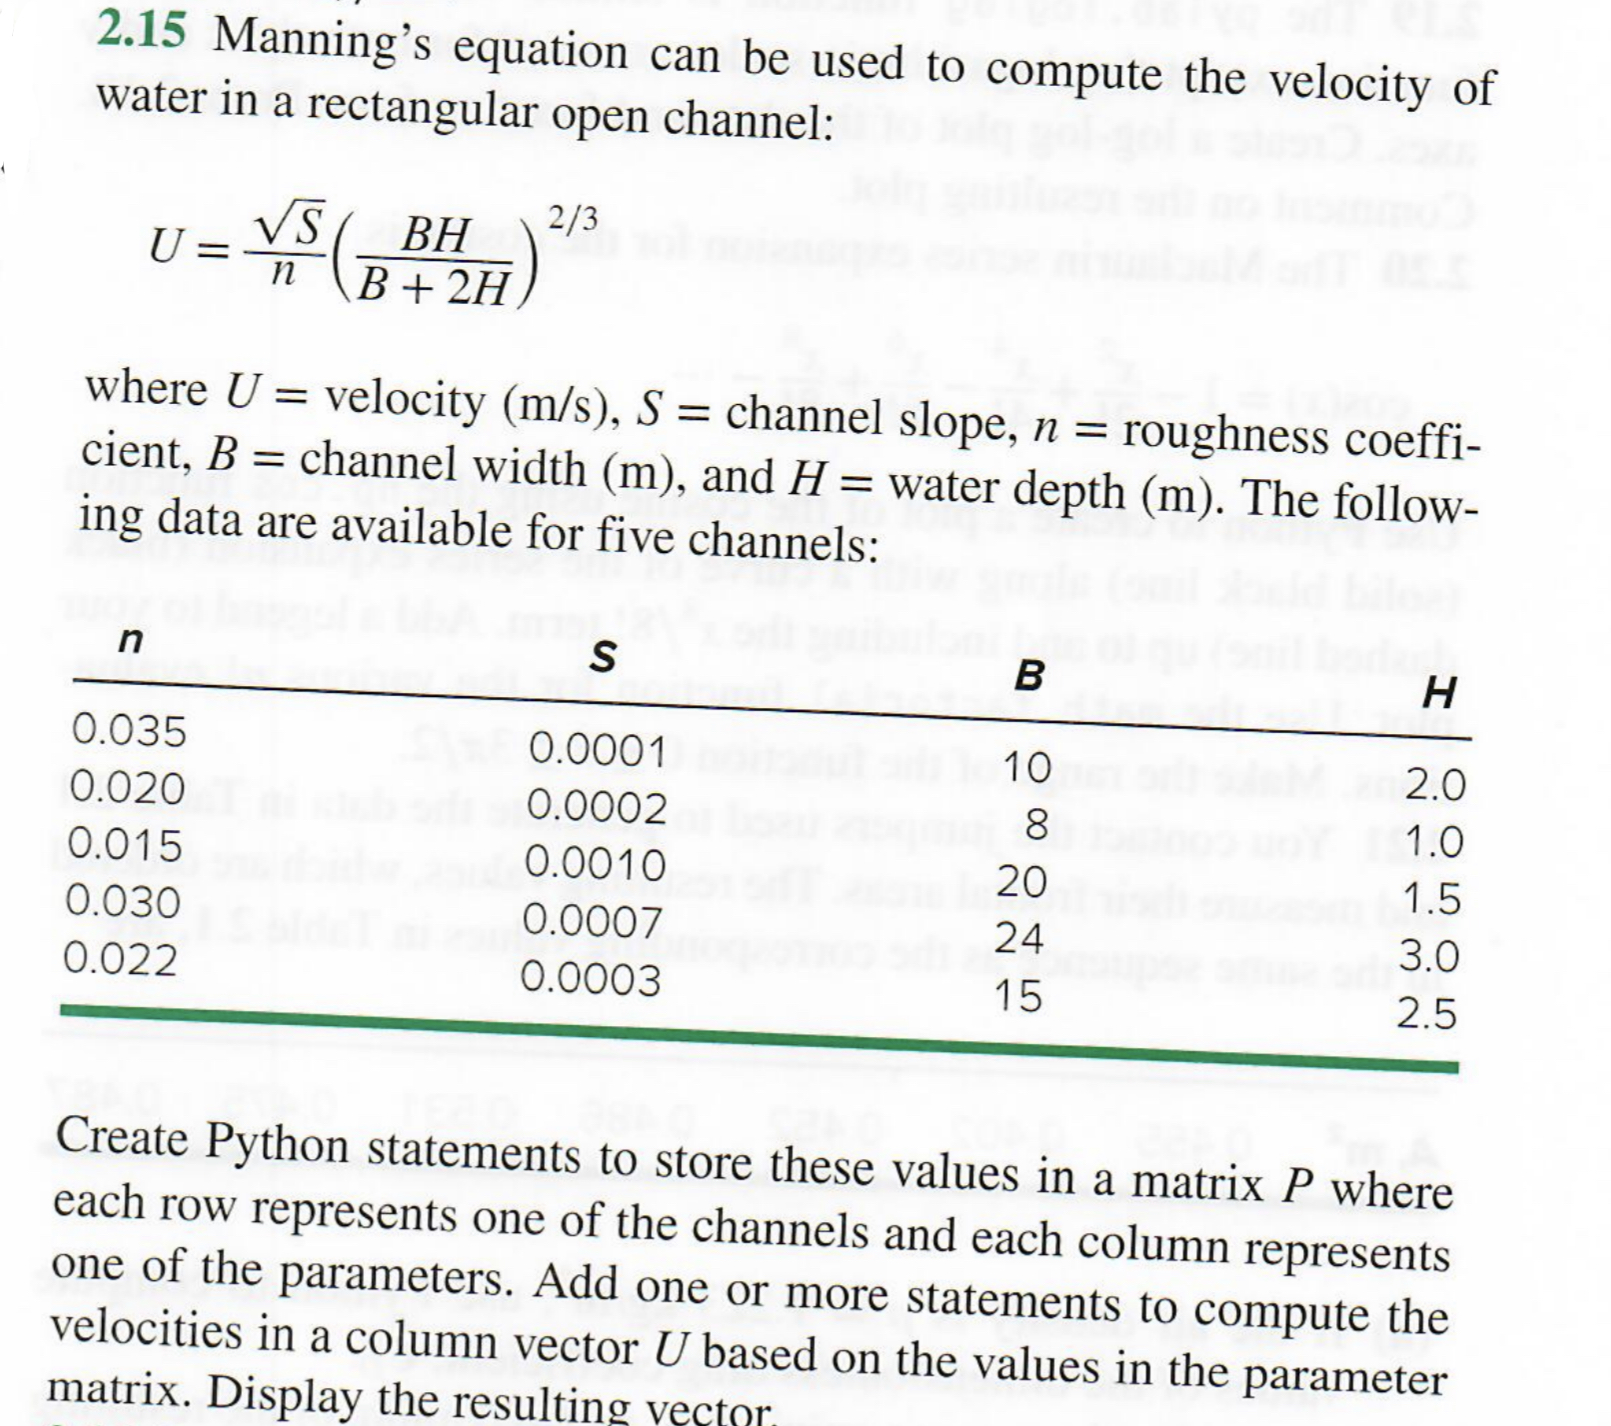
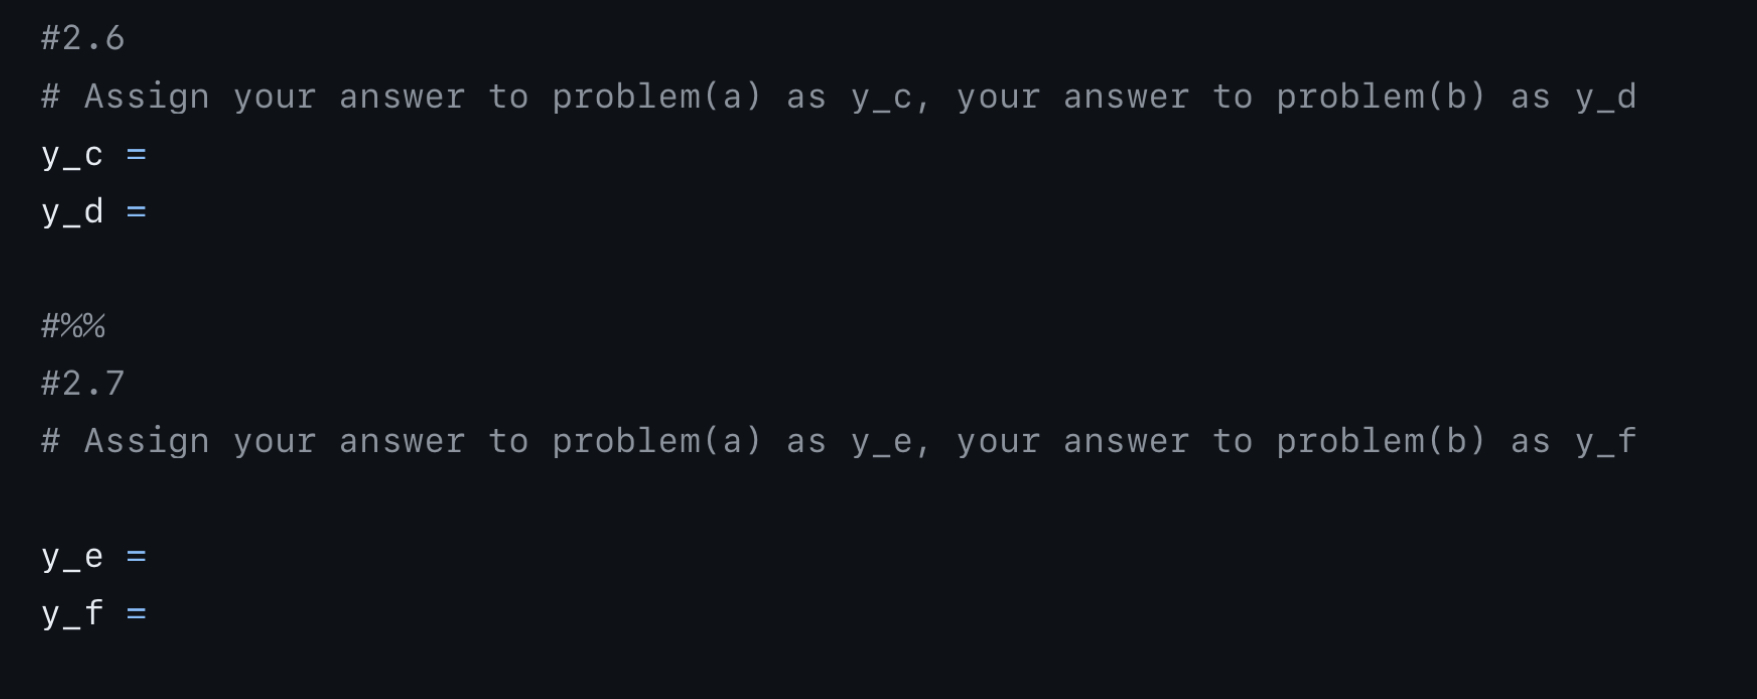
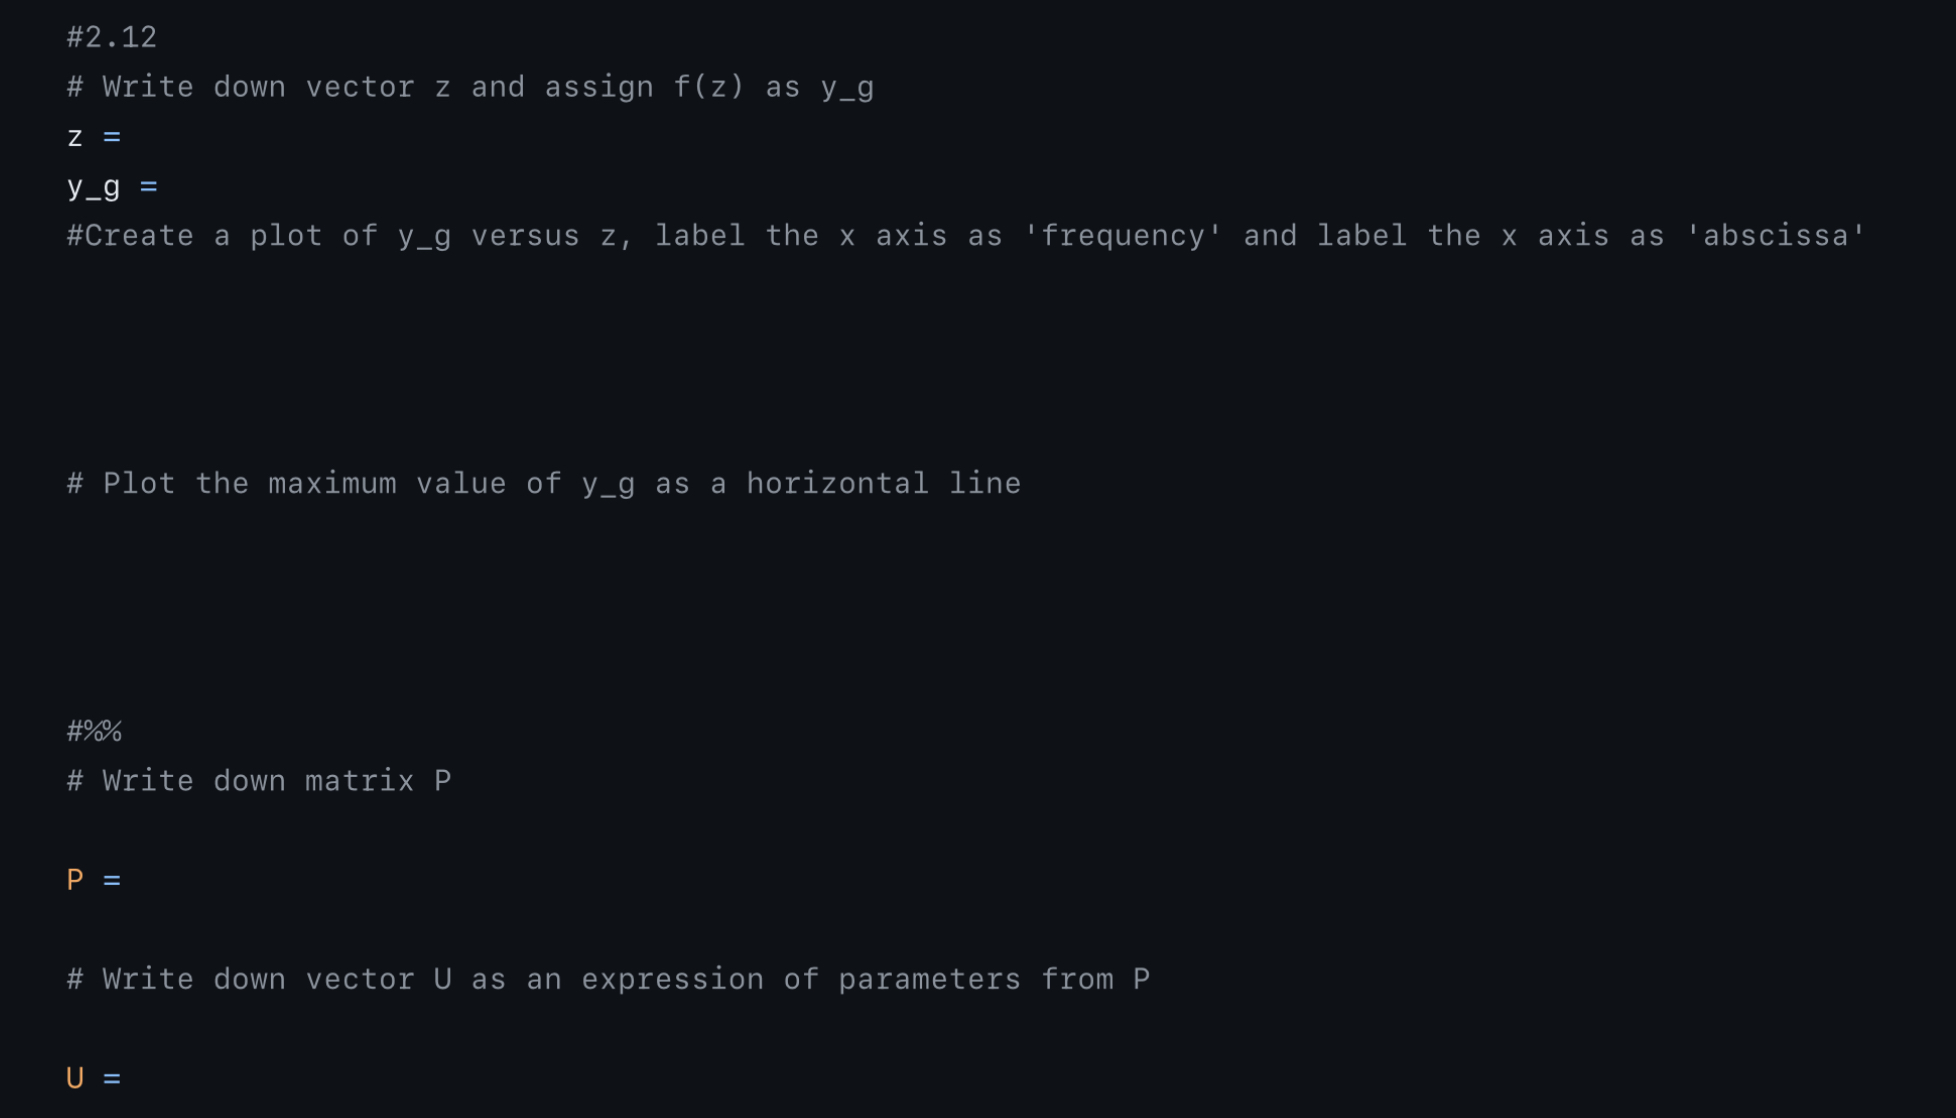
2.2 Create program statements in Python that compute a vector of y values based on the following formulas: 613 - 3t - 4 (a) y= 0.1 < t < 0.25 8 sin(5t) (b) y = 3t - 2 1515 5 4t 2 where t is a vector of 10 values in the range prescribed. Create a plot of y versus t for each of the above. and display aany issues you discover. 2.4 What will be displayed when the following Python statements are run? (a) import numpy as np A = np. matrix ( [ [1 , 2] , [3 , 4 ] , [5, 6]]) print(A) A2 = A[2 , : ] . transpose() print (A2) 2.6 Use the NumPy linspace function to create vectors equivalent to the following Python statements: (a) np. arange (4, 35, 6) (b) np . arange(-4, 2) 2.7 Use NumPy's arange function to create vectors identical to the following created with the 1inspace function: (a) np. linspace(-2, 1. 5,8) (b) np. linspace (8, 4.5,8)2.12 The standard normal probability density function is a bell shaped curve that is described by d the abscissa as 3,. Compute and display the maximum value of f (3,). Where does it occur? 2.15 Manning's equation can be used to compute the velocity of water in a rectangular open channel: U = VS BH 2/3 n B + 2H where U = velocity (m/s), S = channel slope, n = roughness coeffi- cient, B = channel width (m), and H = water depth (m). The follow- ing data are available for five channels: n S B H 0.035 0.0001 10 2.0 0.020 0.0002 8 1.0 0.015 0.0010 20 1.5 0.030 0.0007 24 3.0 0.022 0.0003 15 2.5 Create Python statements to store these values in a matrix P where each row represents one of the channels and each column represents one of the parameters. Add one or more statements to compute the velocities in a column vector U based on the values in the parameter matrix. Display the resulting vectorimport numpy as np import matplotlib . pyplot as plt #2 . 2 # a) # Assign your answer to y_a y_a = # Create a plot of y_a # b) # Assign your answer to y_b y_b = # Create a plot of y_b #2. 6 # Assign your answer to problem(a) as y_c, your answer to problem(b) as y_d y_C = y_d = #%% #2 . 7 # Assign your answer to problem(a) as y_e, your answer to problem(b) as y_f ye= y_f =#2 . 12 # Write down vector z and assign f(z) as y_g Z = y_g = #Create a plot of y_g versus z, label the x axis as 'frequency' and label the x axis as 'abscissa' # Plot the maximum value of y_g as a horizontal line #% # Write down matrix P P = # Write down vector U as an expression of parameters from P U =
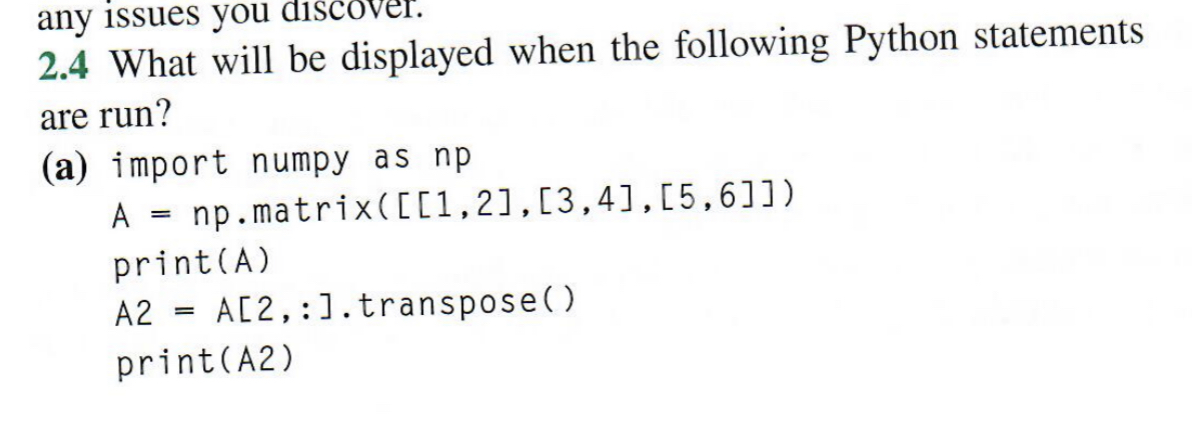
2.2 Create program statements in Python that compute a vector of y values based on the following formulas: 613-31-4 (a) y= 0.1
Step by Step Solution
There are 3 Steps involved in it
Step: 1
1 a tinputenter the vector t for example 1 2 3 and press enter disp...Get Instant Access to Expert-Tailored Solutions
See step-by-step solutions with expert insights and AI powered tools for academic success
Step: 2
Step: 3
Ace Your Homework with AI
Get the answers you need in no time with our AI-driven, step-by-step assistance
Get Started