Answered step by step
Verified Expert Solution
Question
1 Approved Answer
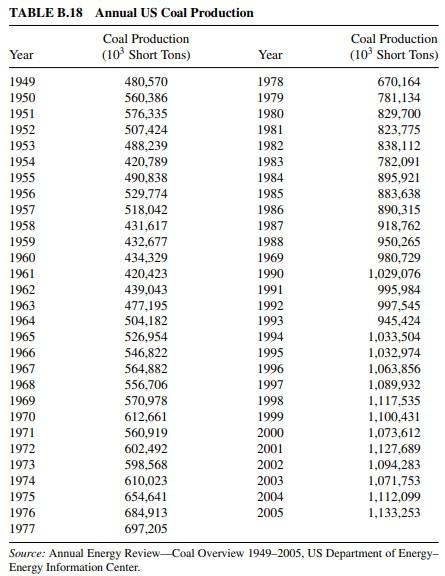
2.21 Data on US coal production are given in Table B.18. Plot the coal production data and calculate the sample autocorrelation function and variogram. Is
2.21 Data on US coal production are given in Table B.18. Plot the coal production data and calculate the sample autocorrelation function and variogram. Is there an indication of nonstationary behavior in the time series? Now plot the first difference of the time series and compute the sample autocorrelation function and variogram of the first differences. What impact has differencing had on the time series? Use R in plotting.

TABLE B.18 Annual US Coal Production Coal Production Coal Production Year (10 Short Tons) Year (10 Short Tons) 1949 480,570 1978 670,164 1950 560,386 1979 781,134 1951 576,335 1980 829,700 1952 507,424 1981 823,775 1953 488,239 1982 838.112 1954 420,789 1983 782,091 1955 490,838 1984 895,921 1956 529.774 1985 883,638 1957 518,042 1986 890,315 1958 431,617 1987 918,762 1959 432,677 1988 950.265 1960 434,329 1969 980,729 1961 420,423 1990 1,029,076 1962 439,043 1991 995,984 1963 477,195 1992 997,545 1964 504,182 1993 945,424 1965 526,954 1994 1,033,504 1966 546,822 1995 1,032,974 1967 564,882 1996 1,063,856 1968 556,706 1997 1,089.932 1969 570,978 1998 1,117,535 1970 612.661 1999 1,100.431 1971 560,919 2000 1,073,612 1972 602.492 2001 1,127,689 1973 598,568 2002 1,094,283 1974 610,023 2003 1,071,753 1975 654,641 2004 1,112,099 1976 684,913 2005 1,133,253 1977 697.205 Source: Annual Energy Review-Coal Overview 19492005, US Department of Energy- Energy Information Center. TABLE B.18 Annual US Coal Production Coal Production Coal Production Year (10 Short Tons) Year (10 Short Tons) 1949 480,570 1978 670,164 1950 560,386 1979 781,134 1951 576,335 1980 829,700 1952 507,424 1981 823,775 1953 488,239 1982 838.112 1954 420,789 1983 782,091 1955 490,838 1984 895,921 1956 529.774 1985 883,638 1957 518,042 1986 890,315 1958 431,617 1987 918,762 1959 432,677 1988 950.265 1960 434,329 1969 980,729 1961 420,423 1990 1,029,076 1962 439,043 1991 995,984 1963 477,195 1992 997,545 1964 504,182 1993 945,424 1965 526,954 1994 1,033,504 1966 546,822 1995 1,032,974 1967 564,882 1996 1,063,856 1968 556,706 1997 1,089.932 1969 570,978 1998 1,117,535 1970 612.661 1999 1,100.431 1971 560,919 2000 1,073,612 1972 602.492 2001 1,127,689 1973 598,568 2002 1,094,283 1974 610,023 2003 1,071,753 1975 654,641 2004 1,112,099 1976 684,913 2005 1,133,253 1977 697.205 Source: Annual Energy Review-Coal Overview 19492005, US Department of Energy- Energy Information Center
Step by Step Solution
There are 3 Steps involved in it
Step: 1

Get Instant Access to Expert-Tailored Solutions
See step-by-step solutions with expert insights and AI powered tools for academic success
Step: 2

Step: 3

Ace Your Homework with AI
Get the answers you need in no time with our AI-driven, step-by-step assistance
Get Started


