22.answer the incorrect question.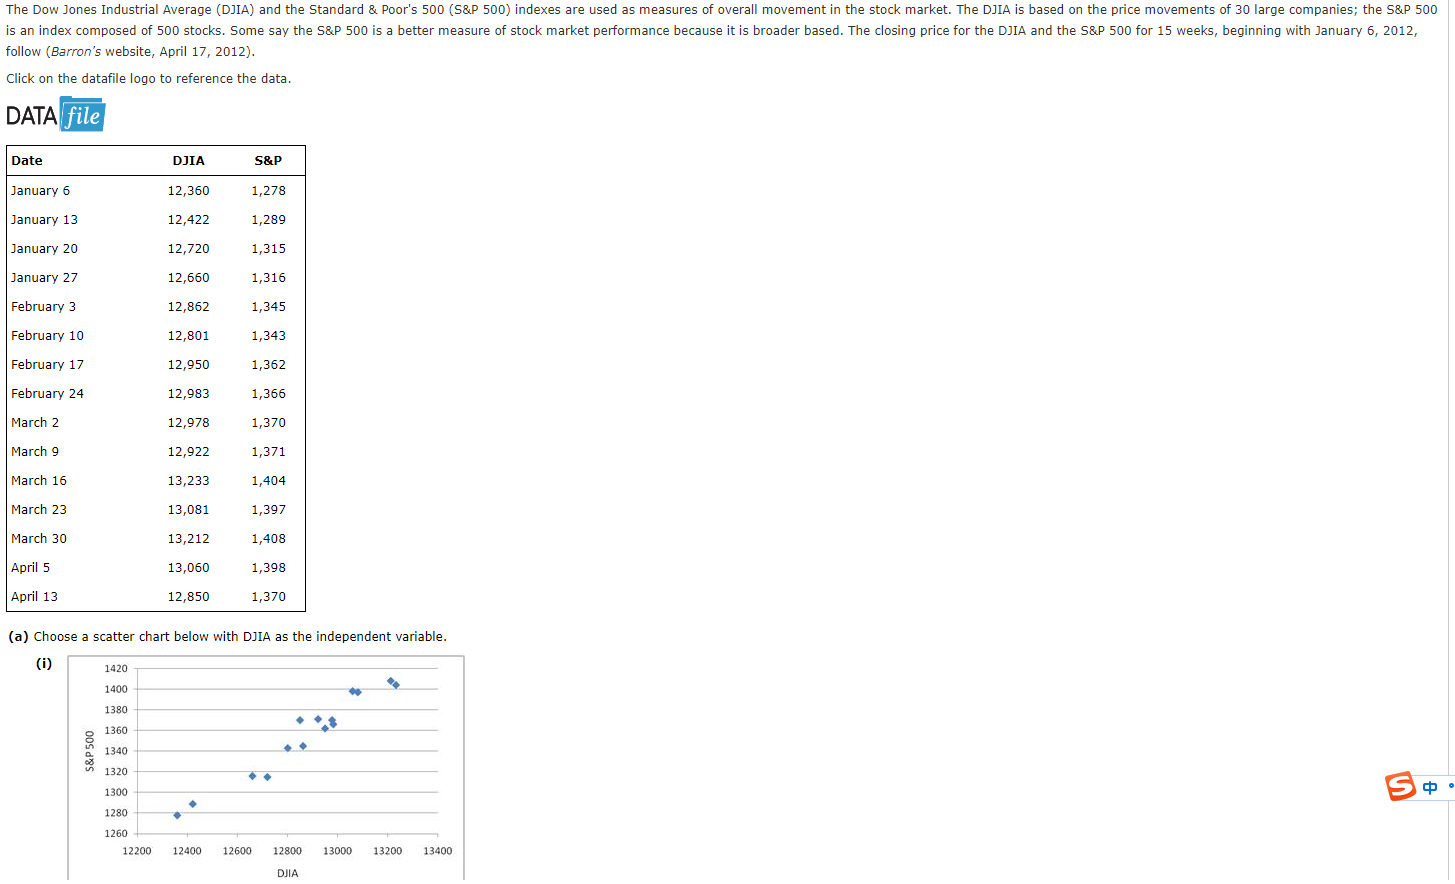
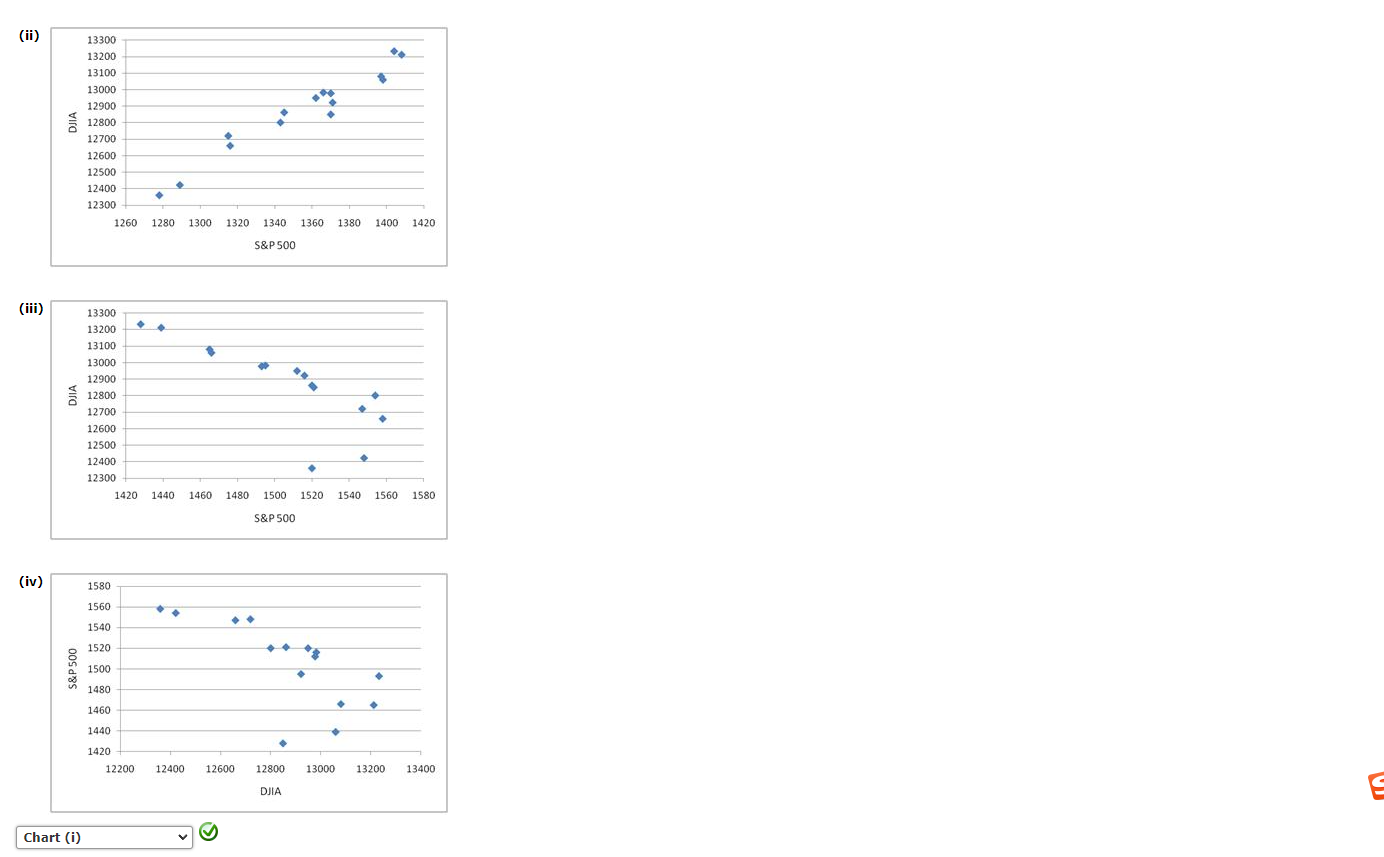
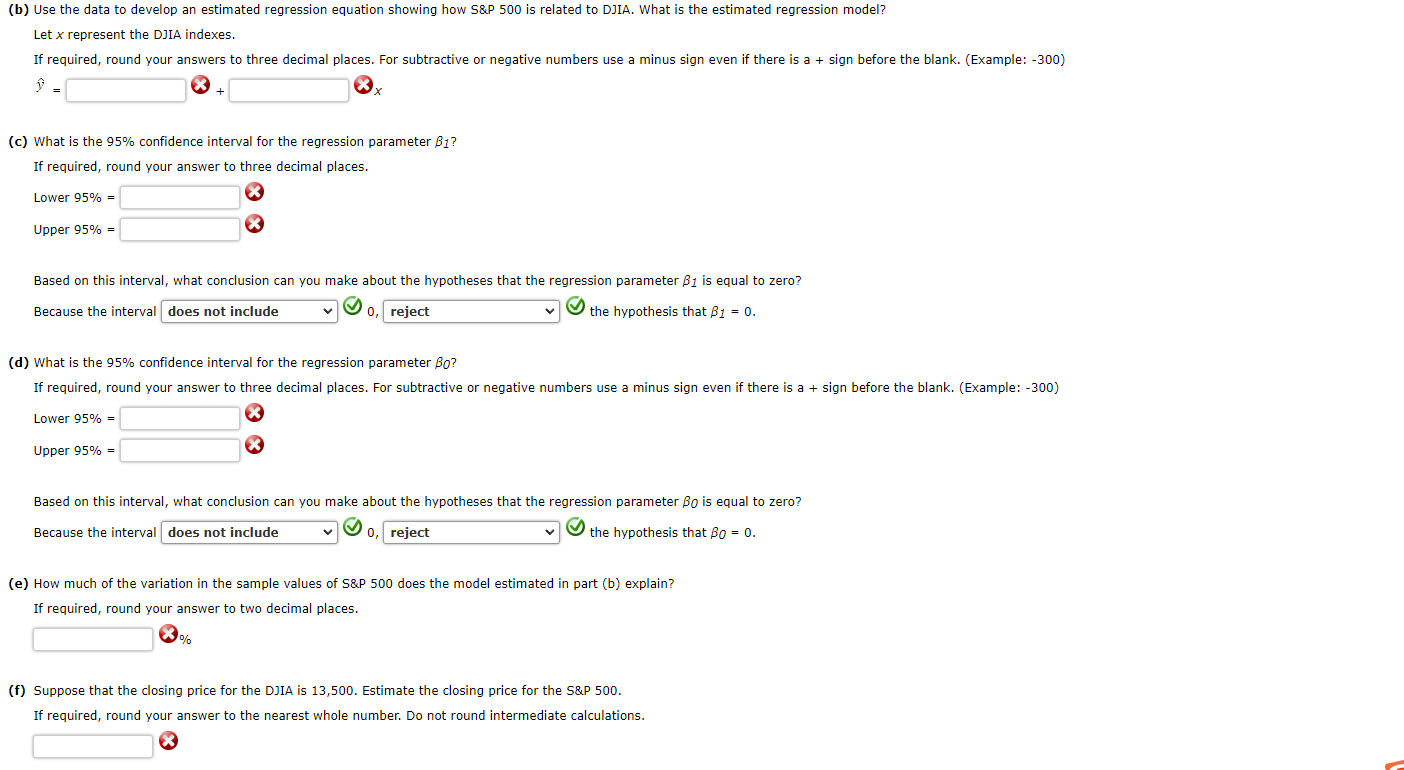
The Dow Jones Industrial Average (DJIA) and the Standard & Poor's 500 (S&P 500) indexes are used as measures of overall movement in the stock market. The DJIA is based on the price movements of 30 large companies; the S&P 500 is an index composed of 500 stocks. Some say the S&P 500 is a better measure of stock market performance because it is broader based. The closing price for the DJIA and the S&P 500 for 15 weeks, beginning with January 6, 2012, follow (Barron's website, April 17, 2012). Click on the datafile logo to reference the data. DATA file Date DJIA S&P January 6 12,360 1,278 January 13 12,422 1,289 January 20 12,720 1,315 January 27 12,660 1,316 February 3 12,862 1,345 February 10 12,801 1,343 February 17 12,950 1,362 12,983 1,366 February 24 March 2 12,978 1,370 March 9 12,922 1,371 March 16 13,233 1,404 March 23 13,081 1,397 March 30 13,212 1,408 April 5 13,060 1,398 April 13 12,850 1,370 (a) Choose a scatter chart below with DJIA as the independent variable. (i) 1420 1400 1380 . 1360 S&P 500 1340 1320 1300 S 1280 1260 12200 12400 12600 12800 13000 13200 13400 DJIA (ii) ) DJIA 13300 13200 13100 13000 12900 12800 200 12700 12600 12500 12400 12300 1260 1280 1300 1320 1340 1360 1380 1400 1420 S&P 500 (iii) . 13300 13200 13100 13000 12900 no 12800 12700 12600 12500 12400 12300 1420 1440 1460 1480 1500 1520 1540 1560 1580 S&P 500 (iv) 1580 1560 1540 1520 S&P 500 1500 1480 1460 1440 1420 12200 12400 12600 12800 13000 13200 13400 W DJIA Chart (0) (b) Use the data to develop an estimated regression equation showing how S&P 500 is related to DJIA. What is the estimated regression model? Let x represent the DIA indexes. If required, round your answers to three decimal places. For subtractive or negative numbers use a minus sign even if there is a + sign before the blank. (Example: -300) 9 (c) What is the 95% confidence interval for the regression parameter B1? If required, round your answer to three decimal places. Lower 95% = Upper 95% = Based on this interval, what conclusion can you make about the hypotheses that the regression parameter B1 is equal to zero? Because the interval does not include 0, reject the hypothesis that B1 = 0. (d) What is the 95% confidence interval for the regression parameter Bo? If required, round your answer to three decimal places. For subtractive or negative numbers use a minus sign even if there is a + sign before the blank. (Example: -300) Lower 95% = Upper 95% = Based on this interval, what conclusion can you make about the hypotheses that the regression parameter Bo is equal to zero? Because the interval does not include o, reject the hypothesis that Bo = 0. (e) How much of the variation in the sample values of S&P 500 does the model estimated in part (b) explain? If required, round your answer to two decimal places. % (f) Suppose that the closing price for the DJIA is 13,500. Estimate the closing price for the S&P 500. If required, round your answer to the nearest whole number. Do not round intermediate calculations