

Answered step by step
Verified Expert Solution
Question
1 Approved Answer
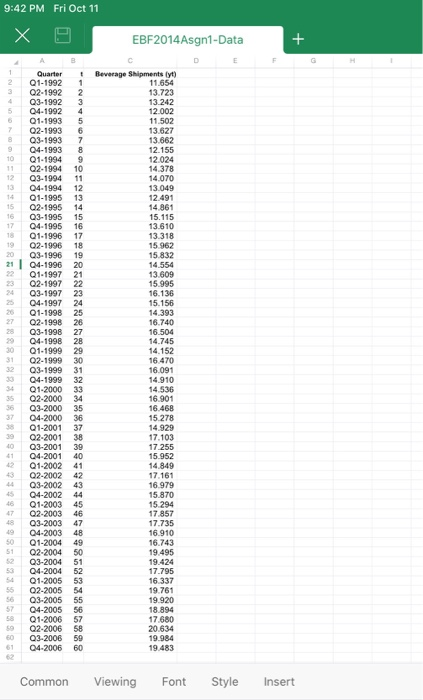
2.2Estimating seasonality and making seasonal forecasts(13 marks) (F)Indicate the patterns in the above-fitted errors {et} (by plotting the data and observing the graph).(1 mark) (G)Define
2.2Estimating seasonality and making seasonal forecasts(13 marks)
(F)Indicate the patterns in the above-fitted errors {et} (by plotting the data and observing the graph).(1 mark)
(G)Define and write down the four quarterly dummy variables D1t, D2t, D3t and D4t.(2 marks)
(H)Regress {et} on the quarterly dummy variables: et = 1D1t + 2D2t + 3D3t + 4D4t + t. Write down this new fitted-model, and briefly explain the meanings of the results.(3 marks)
(I)Is this model a good one? Comment using R2 and t-test.(2 marks)
(J) Based on this fitted model, forecast the et values from Q1-2007 to Q4-2007. Also find the confidence interval for the forecast for Q4-2012. (3 marks)
(K)Adding up the above two forecasts [one for trend and one for errors] results in the final forecasts for yt. Write down these forecasts from Q1-2007 to Q4-2007.(2 marks)
Step by Step Solution
There are 3 Steps involved in it
Step: 1

Get Instant Access to Expert-Tailored Solutions
See step-by-step solutions with expert insights and AI powered tools for academic success
Step: 2

Step: 3
Ace Your Homework with AI
Get the answers you need in no time with our AI-driven, step-by-step assistance
Get Started
Handbook Of Experimental Finance
Authors: Sascha Füllbrunn, Ernan Haruvy
1st Edition
1800372329, 978-1800372320