

Question
24 20 16 12 8 4 Ol 2 4 6 8 10 12 14 16 18 A 16 B 17 C 18 D 19 X

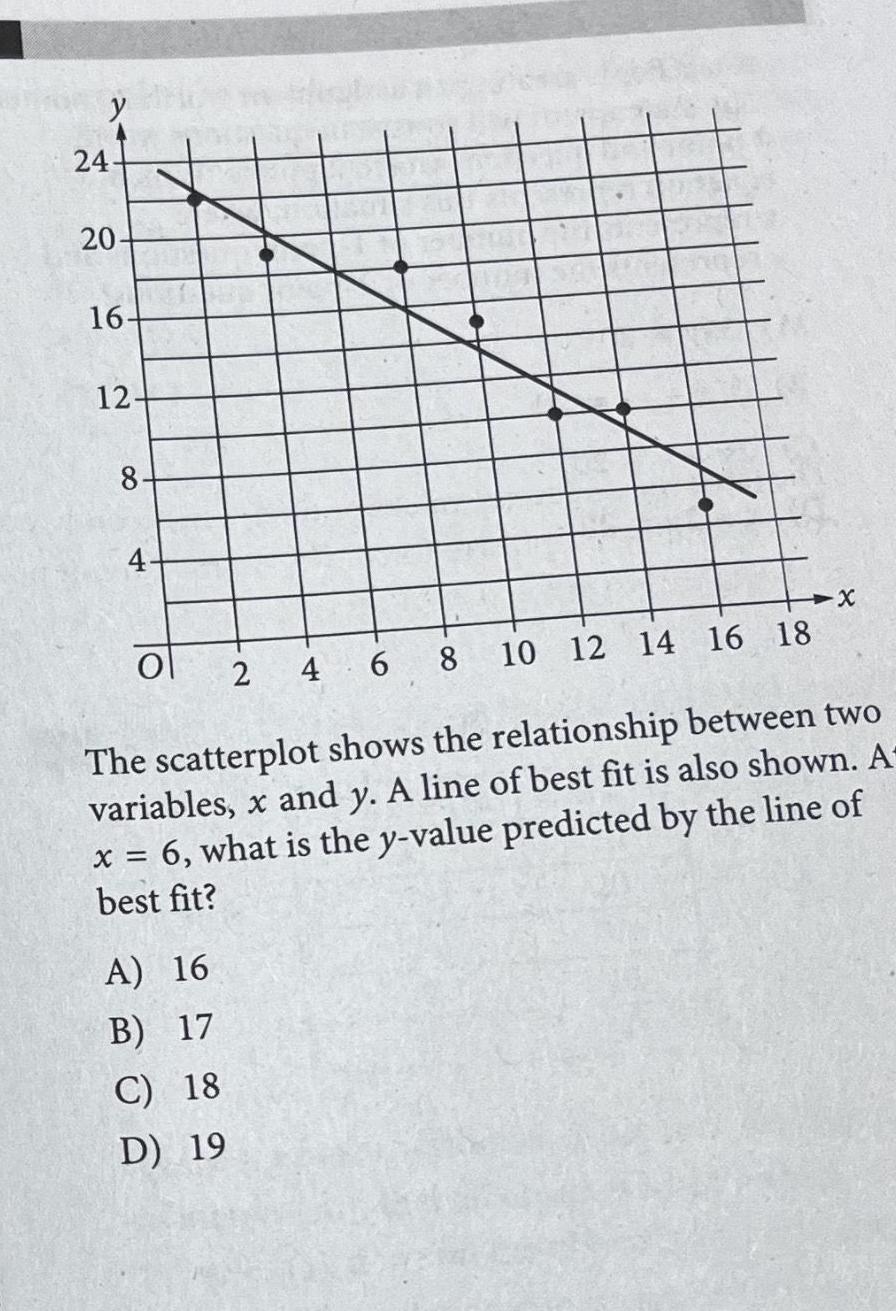
24 20 16 12 8 4 Ol 2 4 6 8 10 12 14 16 18 A 16 B 17 C 18 D 19 X The scatterplot shows the relationship between two variables x and y A line of best fit is also shown A x 6 what is the y value predicted by the line of best fit
Step by Step Solution
There are 3 Steps involved in it
Step: 1

Get Instant Access to Expert-Tailored Solutions
See step-by-step solutions with expert insights and AI powered tools for academic success
Step: 2

Step: 3
Ace Your Homework with AI
Get the answers you need in no time with our AI-driven, step-by-step assistance
Get Started
Differential Geometry Of Curves And Surfaces Revised And Updated
Authors: Manfredo P Do Carmo
1st Edition
0486817970, 9780486817972