Answered step by step
Verified Expert Solution
Link Copied!

Question

1 Approved Answer

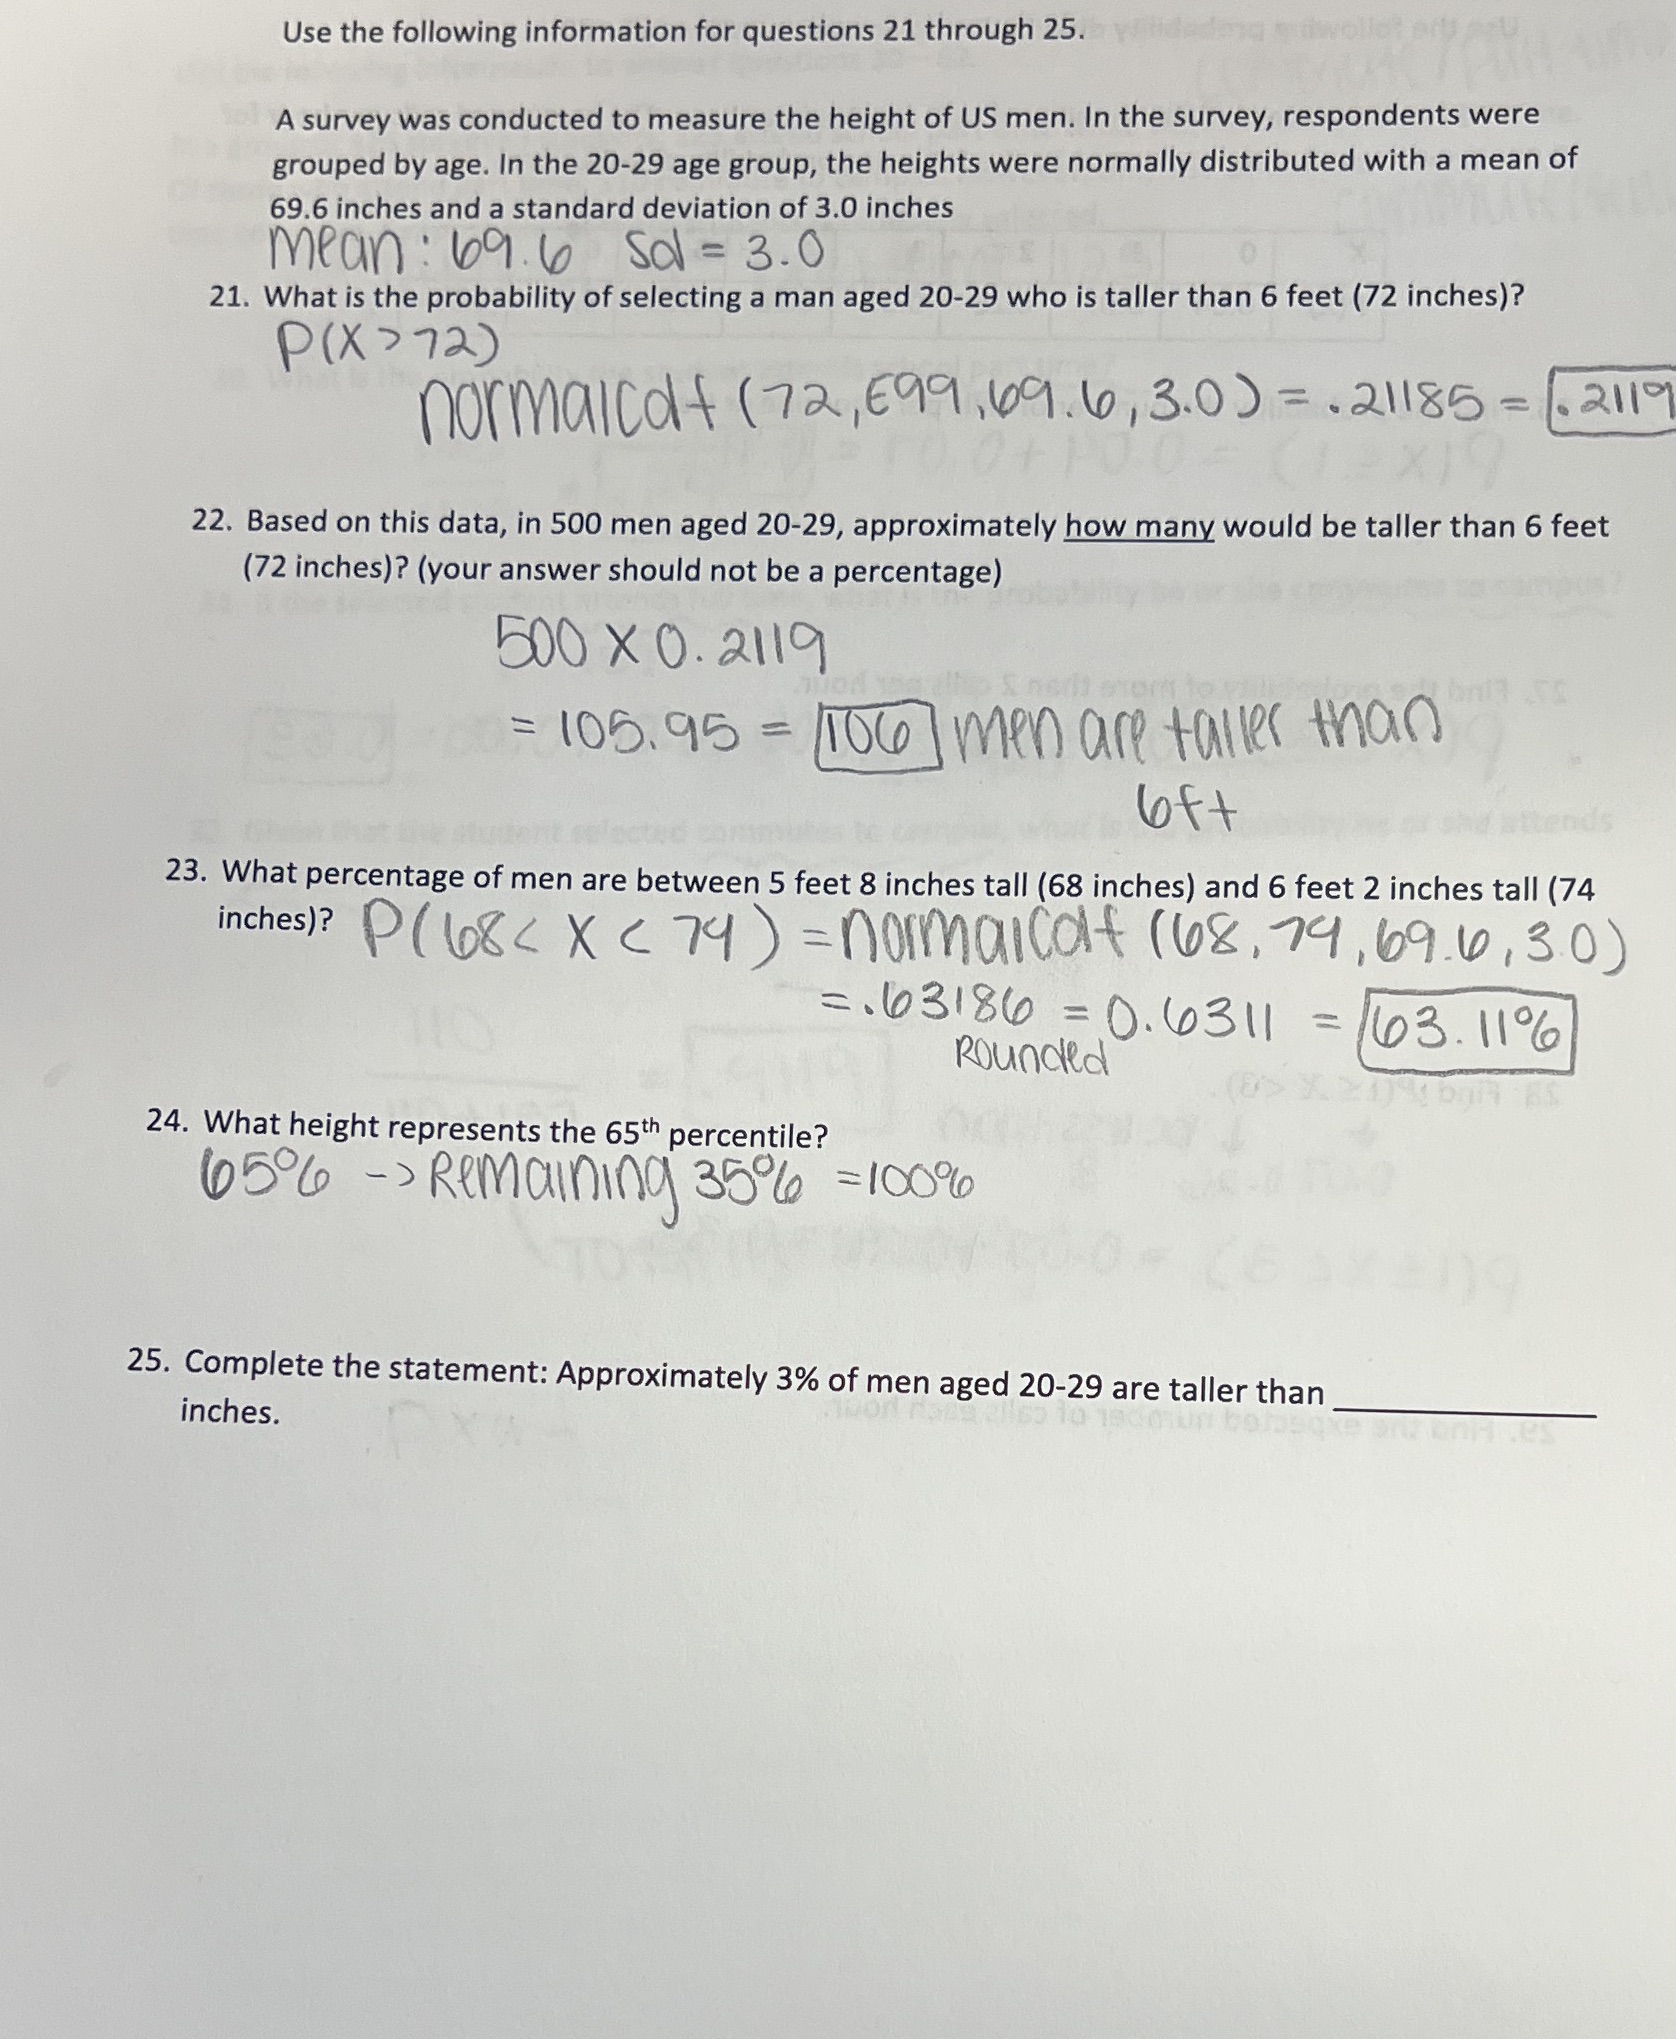
24 and 25 are needed. please use as much calculator work as possible Use the following information for questions 21 through 25. A survey was

image text in transcribed

24 and 25 are needed. please use as much calculator work as possible

image text in transcribed
Use the following information for questions 21 through 25. A survey was conducted to measure the height of US men. In the survey, respondents were grouped by age. In the 20-29 age group, the heights were normally distributed with a mean of 69.6 inches and a standard deviation of 3.0 inches mean: 69.6 501 = 3.0 21. What is the probability of selecting a man aged 20-29 who is taller than 6 feet (72 inches)? P (X >72) normalcdf ( 72, E99 , 69 . 6 , 3.0 ) = . 21185 = . 2110 22. Based on this data, in 500 men aged 20-29, approximately how many would be taller than 6 feet (72 inches)? (your answer should not be a percentage) 500 X 0. 2119 = 105. 95 = /106 ] men are taller than loft 23. What percentage of men are between 5 feet 8 inches tall (68 inches) and 6 feet 2 inches tall (74 inches)? P ( 108

Step by Step Solution

There are 3 Steps involved in it

Step: 1

blur-text-image

Get Instant Access to Expert-Tailored Solutions

See step-by-step solutions with expert insights and AI powered tools for academic success

Step: 2

blur-text-image

Step: 3

blur-text-image

Ace Your Homework with AI

Get the answers you need in no time with our AI-driven, step-by-step assistance

Get Started

Recommended Textbook for

Statistical Inference Via Convex Optimization

Authors: Anatoli Juditsky, Arkadi Nemirovski

1st Edition

0691200319, 9780691200316

More Books

Students also viewed these Mathematics questions

Question

25.0 m C B A 52.0 m 65.0 m

Answered: 1 week ago