

Answered step by step
Verified Expert Solution
Question
1 Approved Answer
25 20 15 2250 10 a of cell phones sold Cellular phone Sales Question 3 of 8 The data provided gives the number of
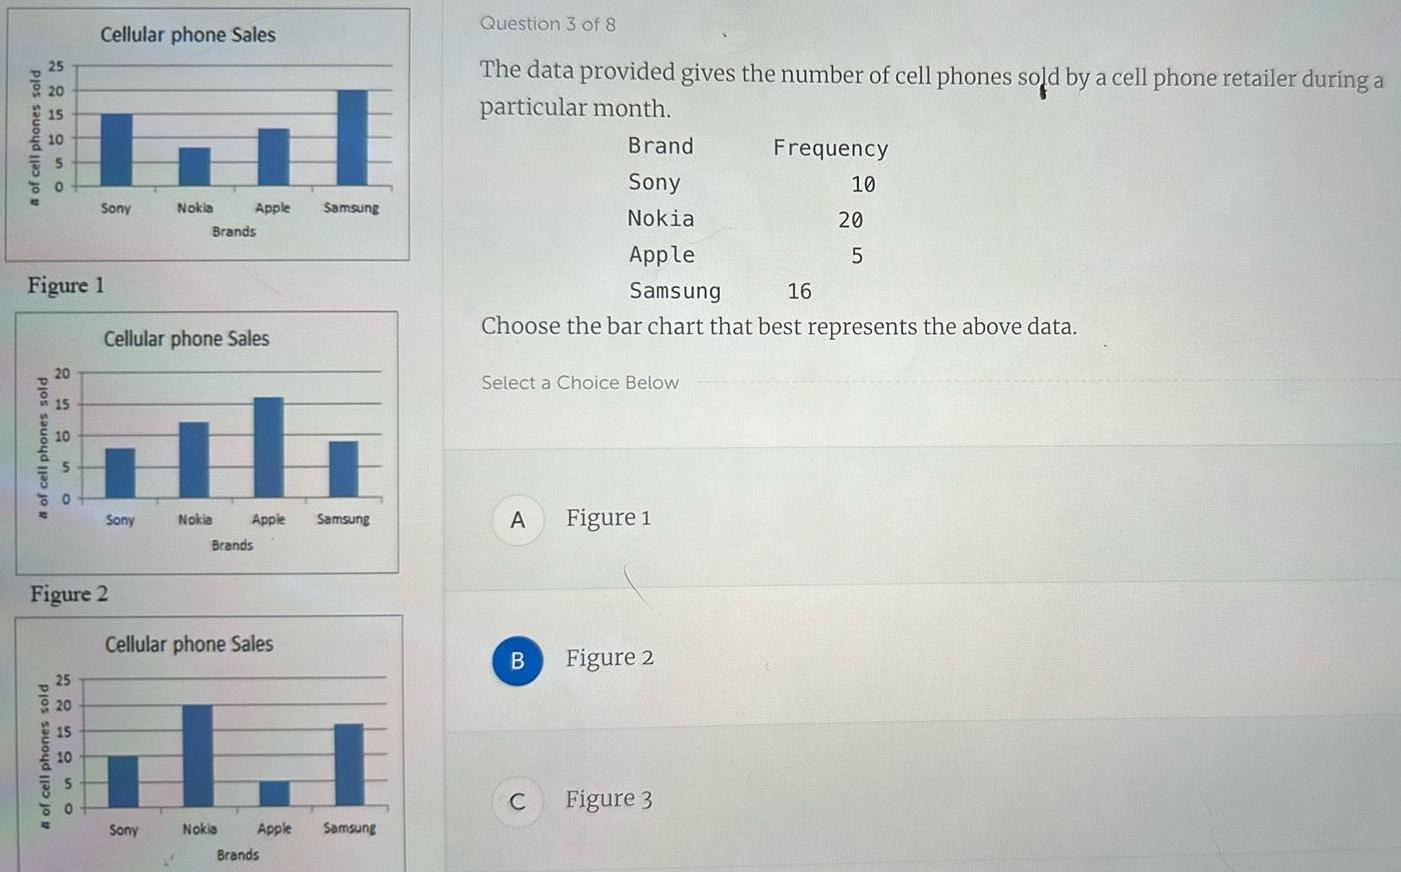
25 20 15 2250 10 a of cell phones sold Cellular phone Sales Question 3 of 8 The data provided gives the number of cell phones sold by a cell phone retailer during a particular month. Brand Sony Nokia Brands Apple Samsung Sony Nokia Apple Frequency 10 20 5 16 Figure 1 20 Cellular phone Sales Samsung Choose the bar chart that best represents the above data. Select a Choice Below 15 10 5 # of cell phones sold Figure 2 Sony Nokia Apple Samsung A Figure 1. Brands Cellular phone Sales B Figure 2 25 20 15 10 # of cell phones sold C Figure 3 Sony Nokia Apple Samsung Brands
Step by Step Solution
There are 3 Steps involved in it
Step: 1

Get Instant Access to Expert-Tailored Solutions
See step-by-step solutions with expert insights and AI powered tools for academic success
Step: 2

Step: 3
Ace Your Homework with AI
Get the answers you need in no time with our AI-driven, step-by-step assistance
Get Started
Supply Chain Focused Manufacturing Planning and Control
Authors: W. C. Benton
1st edition
2901133586714 , 1133586716, 978-1133586715