Question
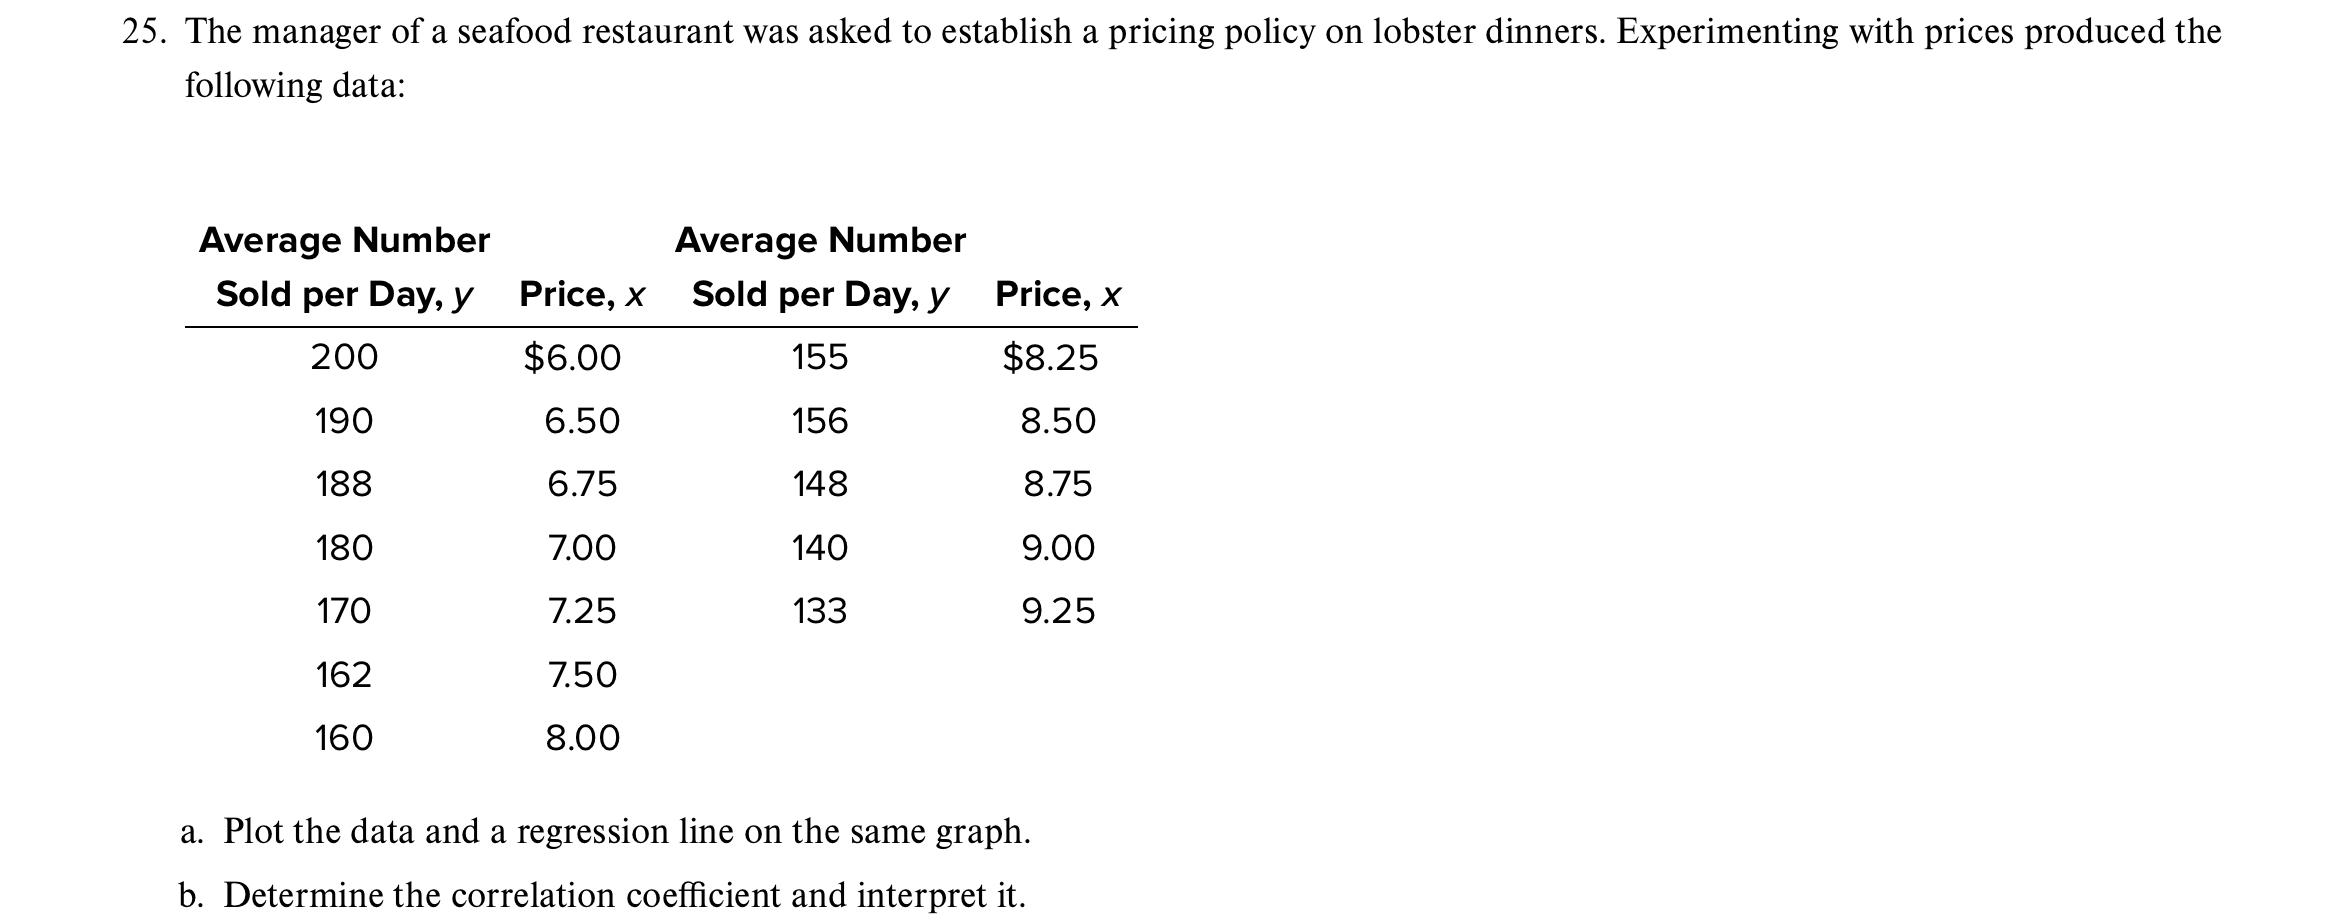
25. The manager of a seafood restaurant was asked to establish a pricing policy on lobster dinners. Experimenting with prices produced the following data:

25. The manager of a seafood restaurant was asked to establish a pricing policy on lobster dinners. Experimenting with prices produced the following data: Average Number Average Number Sold per Day, y Price, x Sold per Day, y Price, x 200 $6.00 155 $8.25 190 6.50 156 8.50 188 6.75 148 8.75 180 7.00 140 9.00 170 7.25 133 9.25 162 7.50 160 8.00 a. Plot the data and a regression line on the same graph. b. Determine the correlation coefficient and interpret it.
Step by Step Solution
There are 3 Steps involved in it
Step: 1

Get Instant Access to Expert-Tailored Solutions
See step-by-step solutions with expert insights and AI powered tools for academic success
Step: 2

Step: 3

Ace Your Homework with AI
Get the answers you need in no time with our AI-driven, step-by-step assistance
Get StartedRecommended Textbook for
Operations Management
Authors: William J Stevenson
12th edition
2900078024107, 78024102, 978-0078024108
Students also viewed these General Management questions
Question
Answered: 1 week ago
Question
Answered: 1 week ago
Question
Answered: 1 week ago
Question
Answered: 1 week ago
Question
Answered: 1 week ago
Question
Answered: 1 week ago
Question
Answered: 1 week ago
Question
Answered: 1 week ago
Question
Answered: 1 week ago
Question
Answered: 1 week ago
Question
Answered: 1 week ago
Question
Answered: 1 week ago
Question
Answered: 1 week ago
Question
Answered: 1 week ago
Question
Answered: 1 week ago
Question
Answered: 1 week ago
Question
Answered: 1 week ago
Question
Answered: 1 week ago
Question
Answered: 1 week ago
View Answer in SolutionInn App


