Answered step by step
Verified Expert Solution
Question
1 Approved Answer
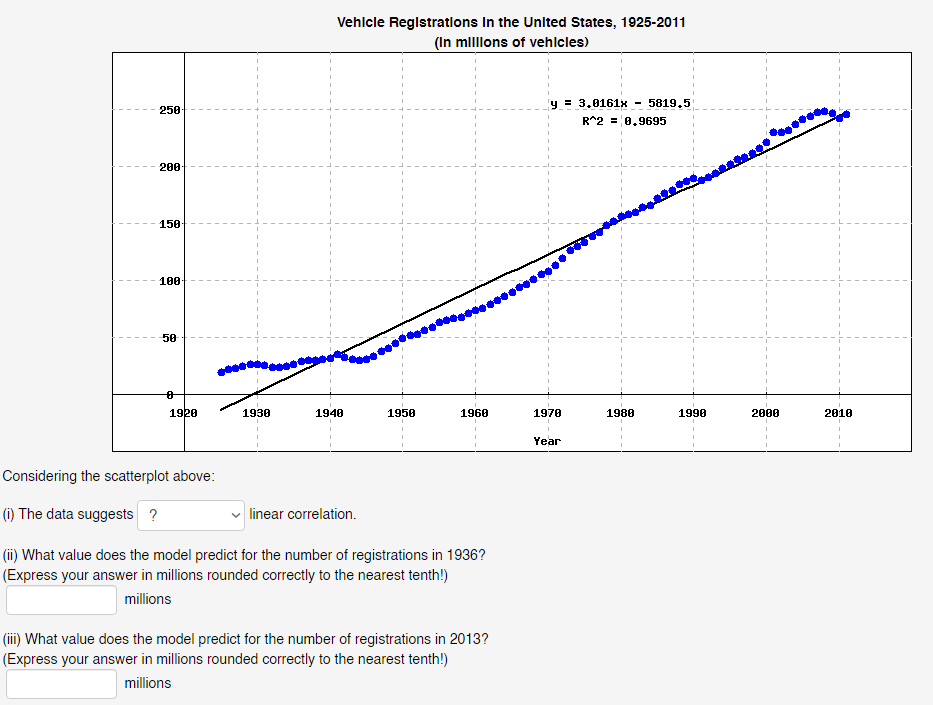
250 200 150- 100 50 Vehicle Registrations In the United States, 1925-2011 (in millions of vehicles) y3.0161x - 5819.5 R^2 = 0.9695 0 1920

250 200 150- 100 50 Vehicle Registrations In the United States, 1925-2011 (in millions of vehicles) y3.0161x - 5819.5 R^2 = 0.9695 0 1920 1930 1940 1950 1960 1970 1980 1990 2000 2010 Year Considering the scatterplot above: (i) The data suggests ? linear correlation. (ii) What value does the model predict for the number of registrations in 1936? (Express your answer in millions rounded correctly to the nearest tenth!) millions (iii) What value does the model predict for the number of registrations in 2013? (Express your answer in millions rounded correctly to the nearest tenth!) millions
Step by Step Solution
There are 3 Steps involved in it
Step: 1

Get Instant Access to Expert-Tailored Solutions
See step-by-step solutions with expert insights and AI powered tools for academic success
Step: 2

Step: 3

Ace Your Homework with AI
Get the answers you need in no time with our AI-driven, step-by-step assistance
Get Started


