26 Take Quiz Exit , Question 1 1. Students in various courses were asked to evaluate their professor. The data taken was for each course,
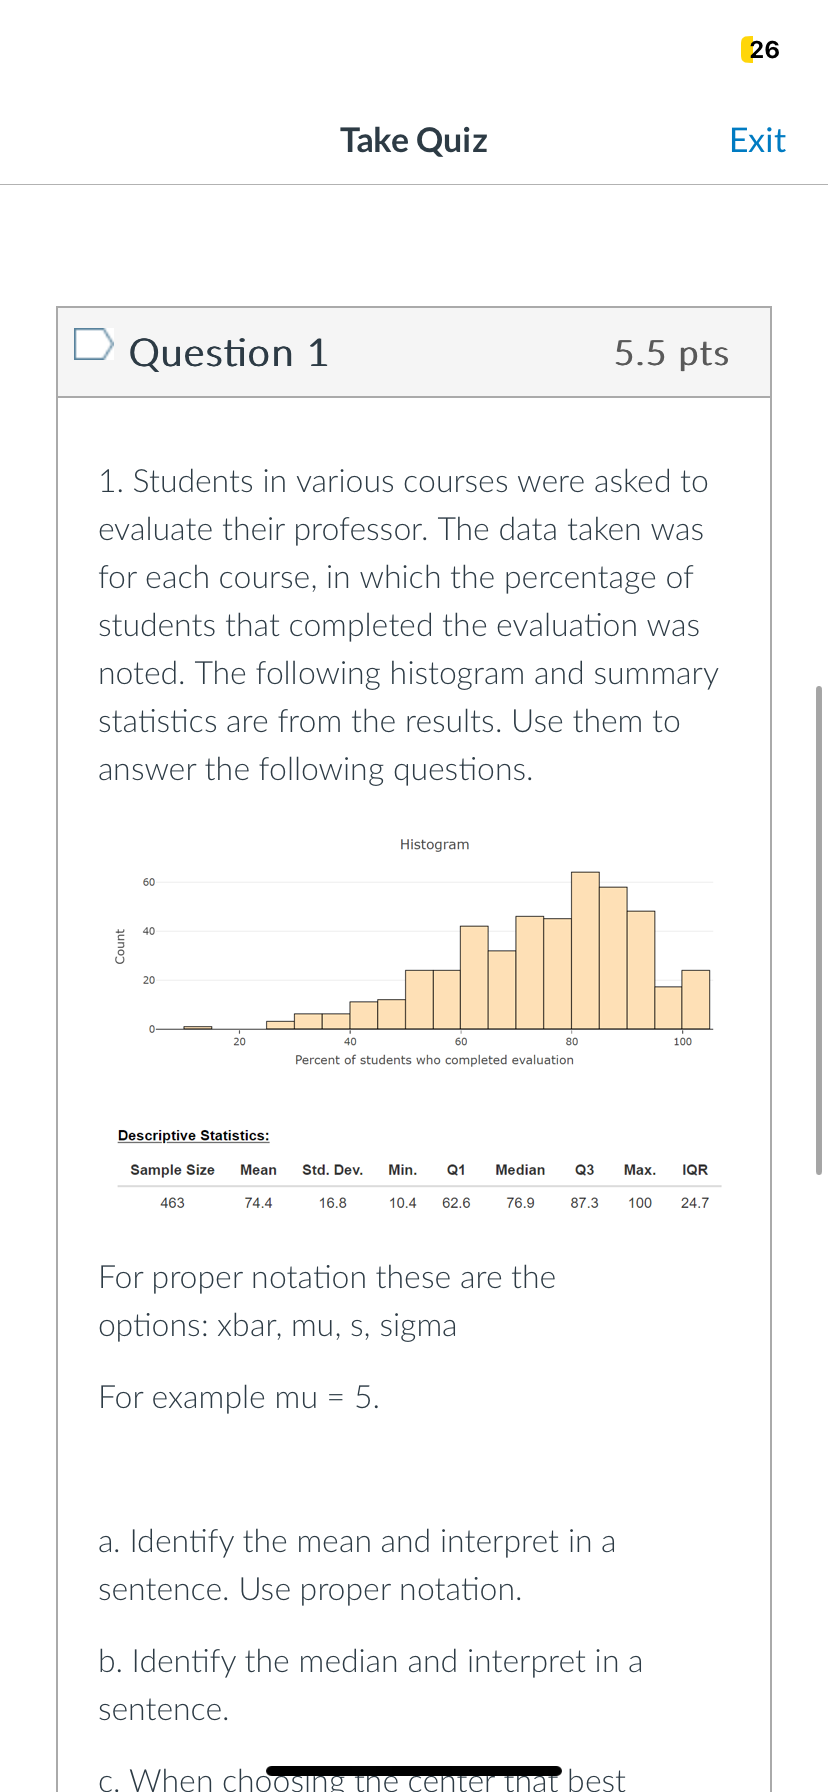
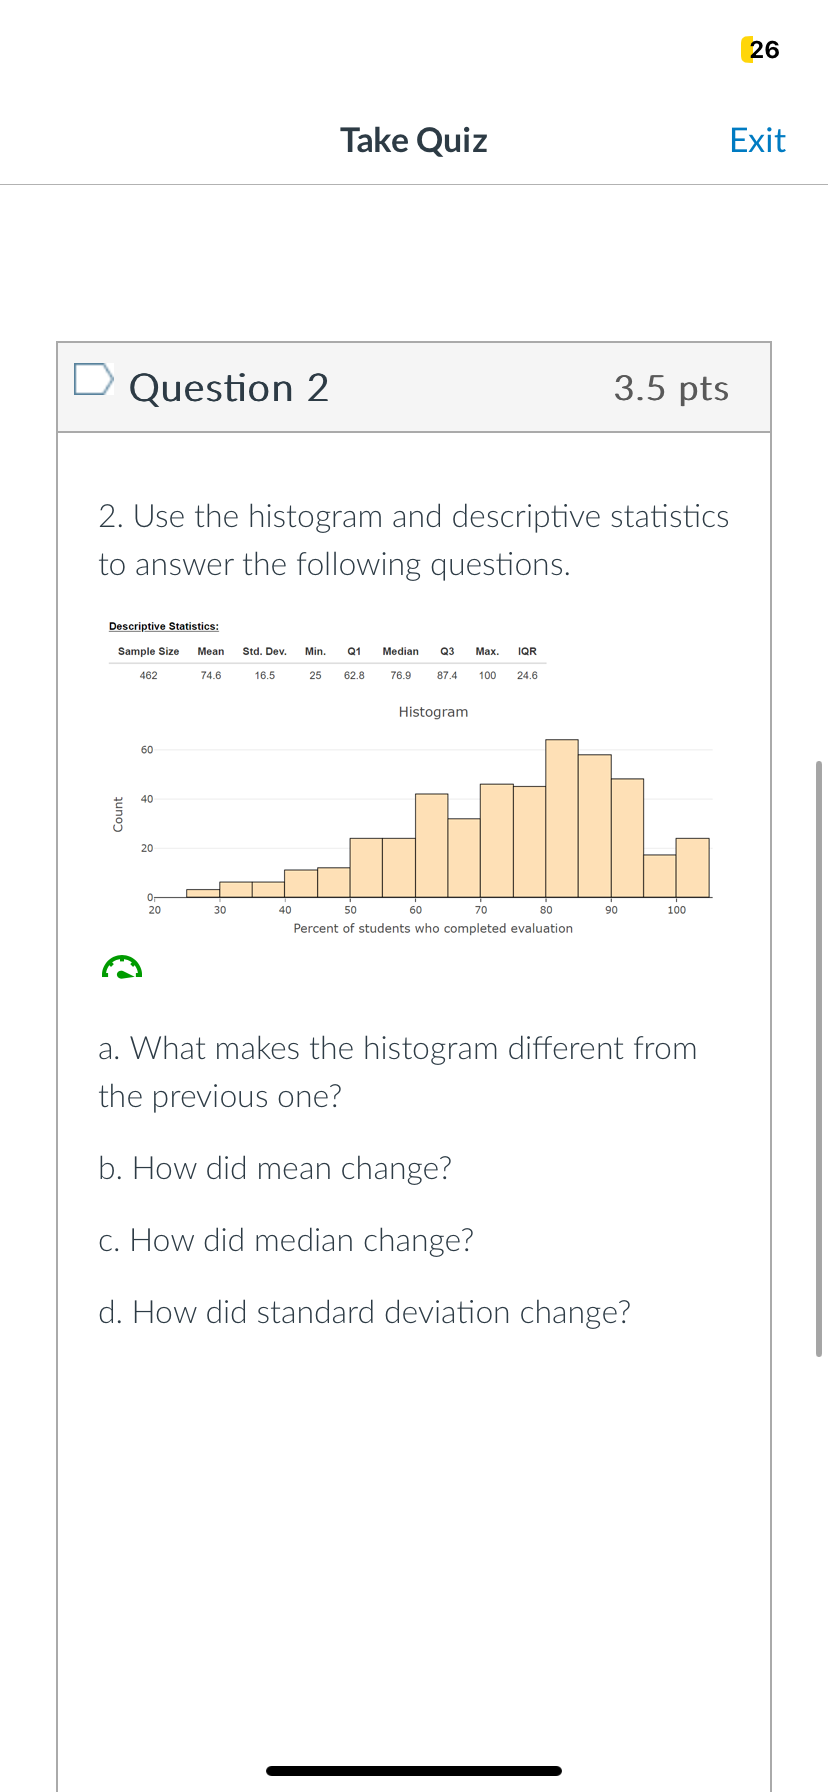
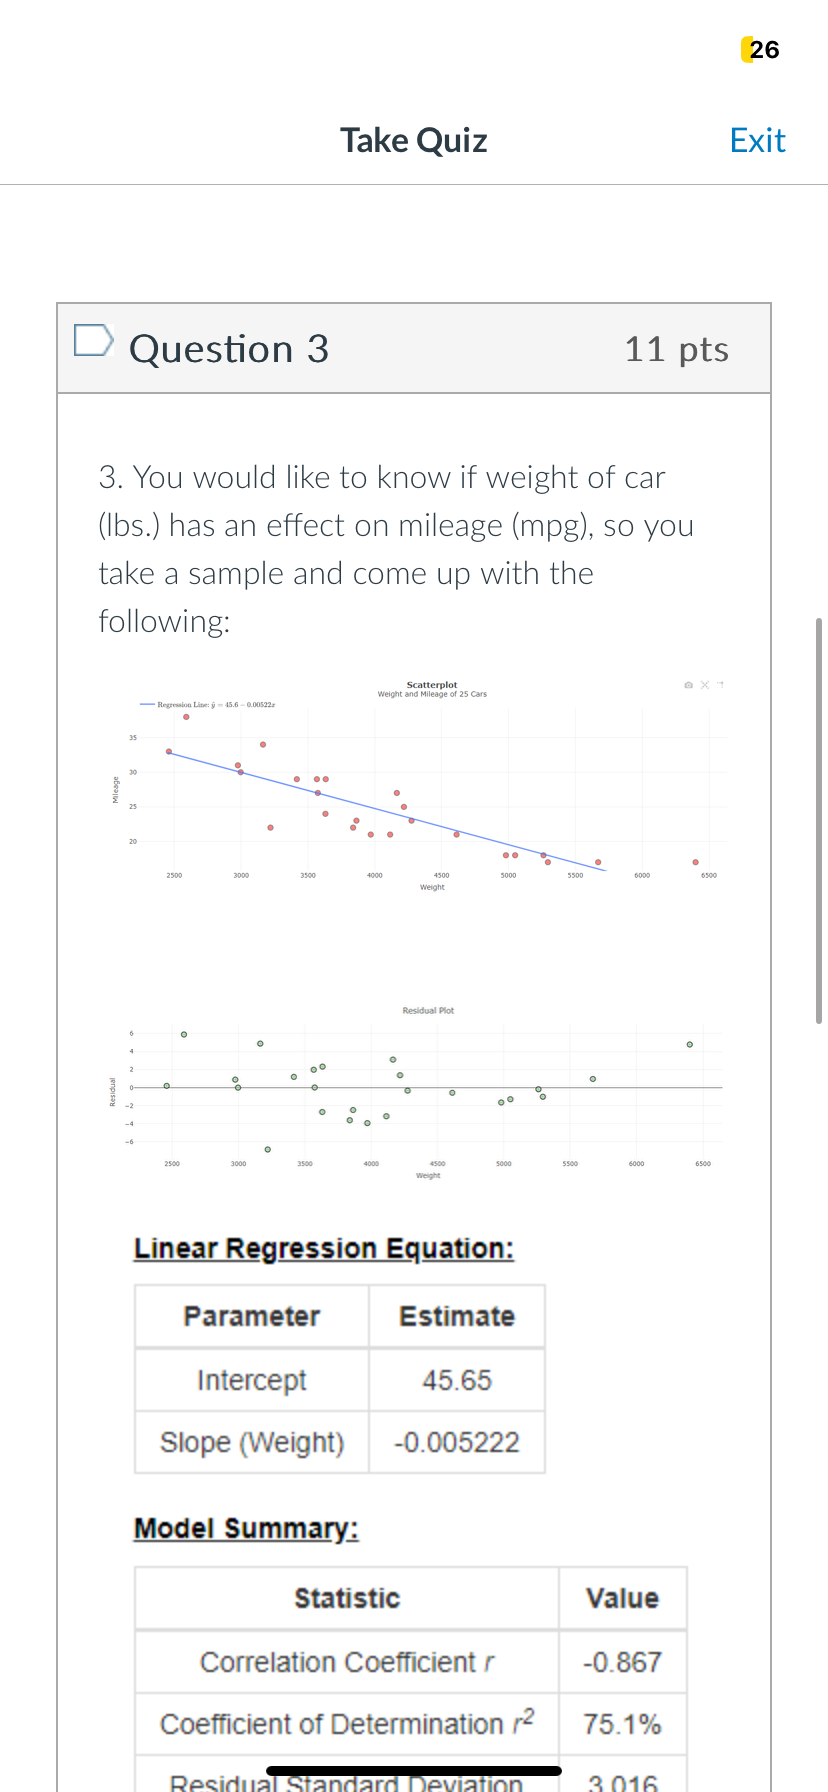
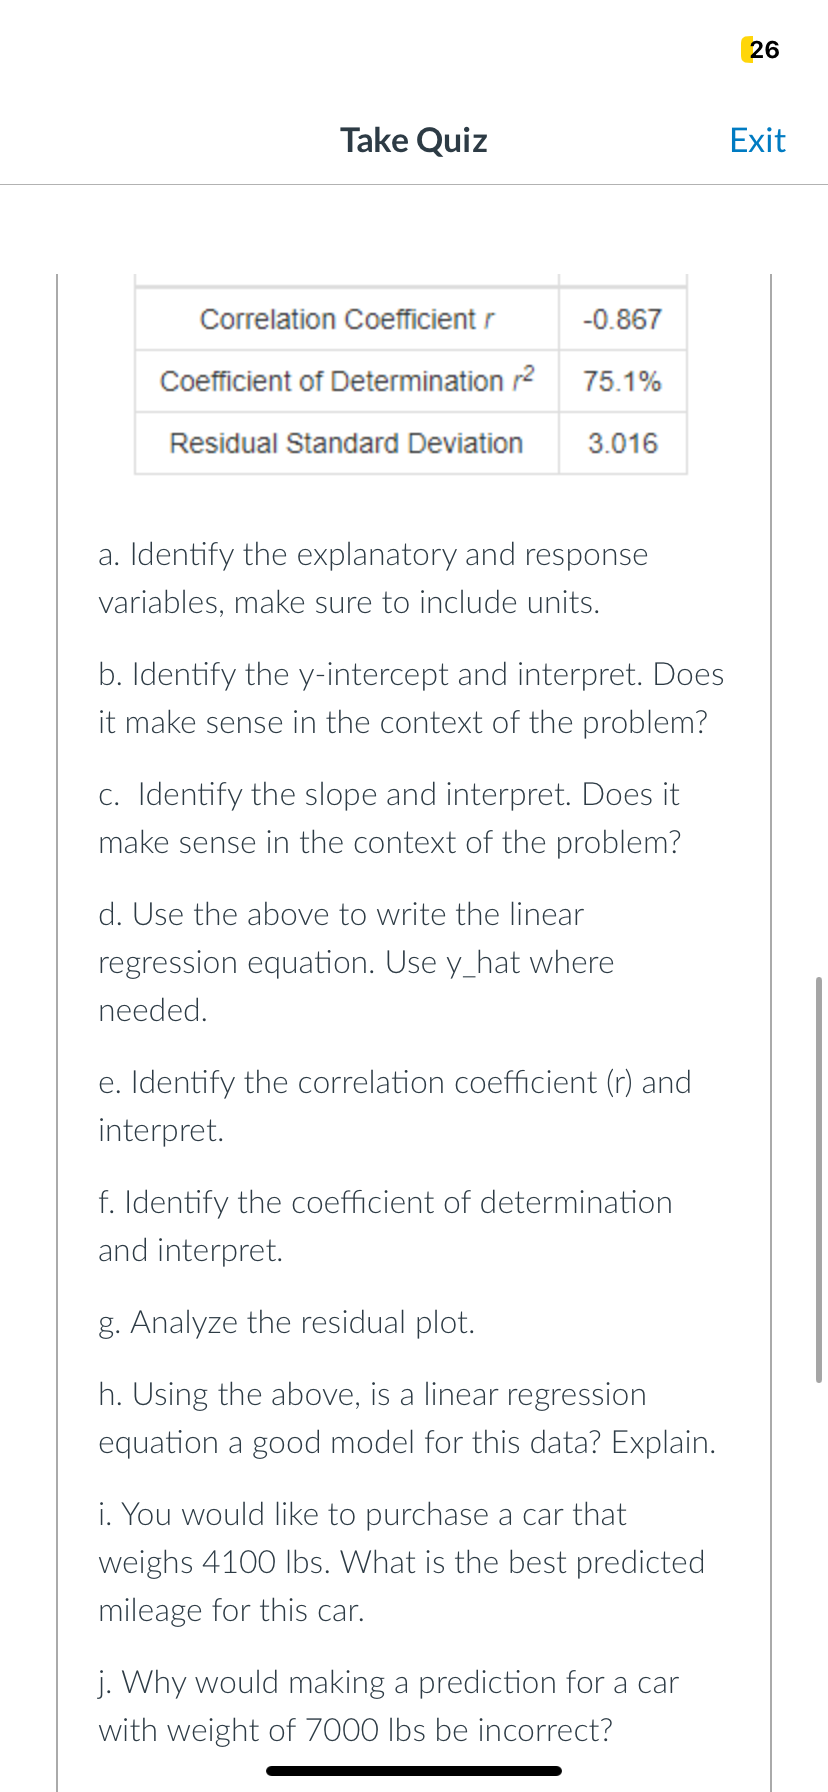
26 Take Quiz Exit , Question 1 1. Students in various courses were asked to evaluate their professor. The data taken was for each course, in which the percentage of students that completed the evaluation was noted. The following histogram and summary statistics are from the results. Use them to answer the following questions. Histogram Count 20 40 &0 80 100 Percent of students who completed evaluation Descriptive Statistics: Sample Size Mean Std.Dev. Min. l Median Q3 Max. IQR 463 74.4 16.8 104 626 76.9 87.3 100 247 For proper notation these are the options: xbar, mu, s, sigma For example mu = 5. a. l[dentify the mean and interpret in a sentence. Use proper notation. b. Identify the median and interpret in a sentence. c. Whencholam e e e best 26 Take Quiz Exit c. When choosing the center that best describes the histogram, which do you choose? Explain. d. Identify the standard deviation and interpret in a sentence. Use proper notation. e. There is a value of 10.4 percent, is this value unusual? Explain. 12pt ~ Paragraph v B 7/ U A P @ Owords > .3 Next 26 Take Quiz Exit ; Question 2 2. Use the histogram and descriptive statistics to answer the following questions. Sample Size Mean Std. Dev. Min. Ql Median Q3 Max. QR 462 748 165 25 62.8 769 874 100 246 Histogram Count 20 30 40 S0 60 70 80 90 100 Percent of students who completed evaluation a. What makes the histogram different from the previous one? b. How did mean change? c. How did median change? d. How did standard deviation change? 26 Take Quiz Exit Question 3 11 pts 3. You would like to know if weight of car (lbs.) has an effect on mileage (mpg), so you take a sample and come up with the following: Scatterplot Weight and Mileage of 25 Cars - Regression Line: 9 - 45.6 - 0.00522x 30 Mileage . 20 . . 2500 3000 3500 4900 4500 5090 5500 6000 6590 weight Residual Plot C O O Residual o 2500 3000 3500 4000 4500 5000 5500 6000 6500 Linear Regression Equation: Parameter Estimate Intercept 45.65 Slope (Weight) -0.005222 Model Summary: Statistic Value Correlation Coefficient r -0.867 Coefficient of Determination r2 75.1% Residua 301626 Take Quiz Exit Correlation Coefficient r -0.867 Coefficient of Determination r2 75.1% Residual Standard Deviation 3.016 a. Identify the explanatory and response variables, make sure to include units. b. Identify the y-intercept and interpret. Does it make sense in the context of the problem? c. Identify the slope and interpret. Does it make sense in the context of the problem? d. Use the above to write the linear regression equation. Use y_hat where needed. e. Identify the correlation coefficient (r) and interpret. f. Identify the coefficient of determination and interpret. g. Analyze the residual plot. h. Using the above, is a linear regression equation a good model for this data? Explain. i. You would like to purchase a car that weighs 4100 lbs. What is the best predicted mileage for this car. j. Why would making a prediction for a car with weight of 7000 lbs be incorrect
Step by Step Solution
There are 3 Steps involved in it
Step: 1
Get Instant Access to Expert-Tailored Solutions
See step-by-step solutions with expert insights and AI powered tools for academic success
Step: 2
Step: 3
Ace Your Homework with AI
Get the answers you need in no time with our AI-driven, step-by-step assistance