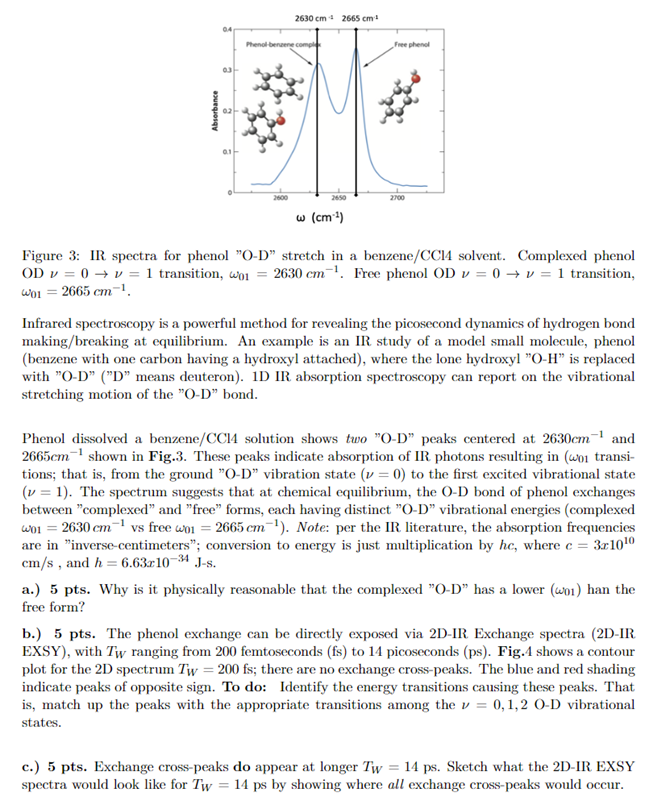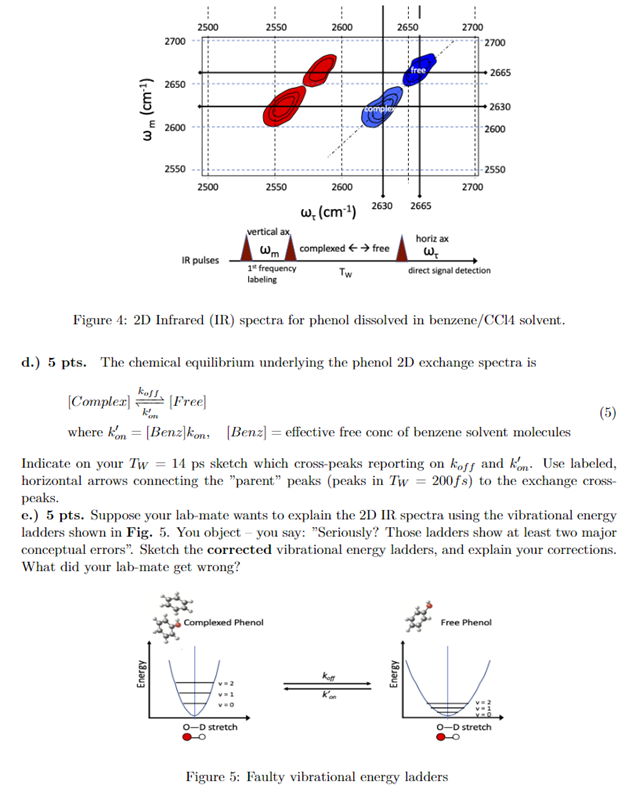

2630 cm 2665 cm 04 Phenol benne.com Free phenol Absorbance 0.1 2600 2650 2700 w (cm) Figure 3: IR spectra for phenol "O-D stretch in a benzene/CC14 solvent. Complexed phenol OD v = 0 + v = 1 transition, w01 = 2630 cm-!. Free phenol OD v = 0 + v = 1 transition, wou = 2665 cm-1 Infrared spectroscopy is a powerful method for revealing the picosecond dynamics of hydrogen bond making/breaking at equilibrium. An example is an IR study of a model small molecule, phenol (benzene with one carbon having a hydroxyl attached), where the lone hydroxyl O-H is replaced with "O-D" ("D" means deuteron). ID IR absorption spectroscopy can report on the vibrational stretching motion of the "O-D" bond. Phenol dissolved a benzene/CC14 solution shows two "O-D" peaks centered at 2630cm-and 2665cm shown in Fig.3. These peaks indicate absorption of IR photons resulting in (woi transi- tions; that is, from the ground "O-D vibration state (v = 0) to the first excited vibrational state (v = 1). The spectrum suggests that at chemical equilibrium, the O-D bond of phenol exchanges between "complexed" and "free" forms, each having distinct "O-D vibrational energies (complexed wo1 = 2630 cm vs free wo1 = 2665 cm!). Note: per the IR literature, the absorption frequencies are in "inverse-centimeters"; conversion to energy is just multiplication by he, where c = 3c1010 cm/s, and h=6.63c10-34 J-s. a.) 5 pts. Why is it physically reasonable that the complexed O-D has a lower (wo1) han the free form? b.) 5 pts. The phenol exchange can be directly exposed via 2D-IR Exchange spectra (2D-IR EXSY), with Tw ranging from 200 femtoseconds (fs) to 14 picoseconds (ps). Fig.1 shows a contour plot for the 2D spectrum Tw = 200 fs; there are no exchange cross-peaks. The blue and red shading indicate peaks of opposite sign. To do: Identify the energy transitions causing these peaks. That is, match up the peaks with the appropriate transitions among the v = 0,1,2 0-D vibrational states. c.) 5 pts. Exchange cross-peaks do appear at longer Tw = 14 ps. Sketch what the 2D-IR EXSY spectra would look like for Tw = 14 ps by showing where all exchange cross-peaks would occur. 2500 2550 2600 2650 2700 2700 2700 free 2665 ( 2650 wm (cm) 2630 2600 E 2600 2550 -2550 2700 2500 2550 2600 2665 2630 w. (cm) vertical ax complexed free 1 frequency TW labeling Wm IR pulses horiz ax WE direct signal detection Figure 4: 2D Infrared (IR) spectra for phenol dissolved in benzene/CC14 solvent. 5 - d.) 5 pts. The chemical equilibrium underlying the phenol 2D exchange spectra is kost, (Complex] [Free] (5) where kom = [Benz]kon[Benz] = effective free conc of benzene solvent molecules Indicate on your Tw = 14 ps sketch which cross-peaks reporting on koff and kom. Use labeled, horizontal arrows connecting the "parent" peaks peaks in Tw = 200fs) to the exchange cross- peaks. c.) 5 pts. Suppose your lab-mate wants to explain the 2D IR spectra using the vibrational energy ladders shown in Fig. 5. You object - you say: "Seriously? Those ladders show at least two major conceptual errors. Sketch the corrected vibrational energy ladders, and explain your corrections. What did your lab-mate get wrong? Complexed Phenol Free Phenol Energy Energy O-D stretch 0-D stretch Figure 5: Faulty vibrational energy ladders


