

Answered step by step
Verified Expert Solution
Question
1 Approved Answer
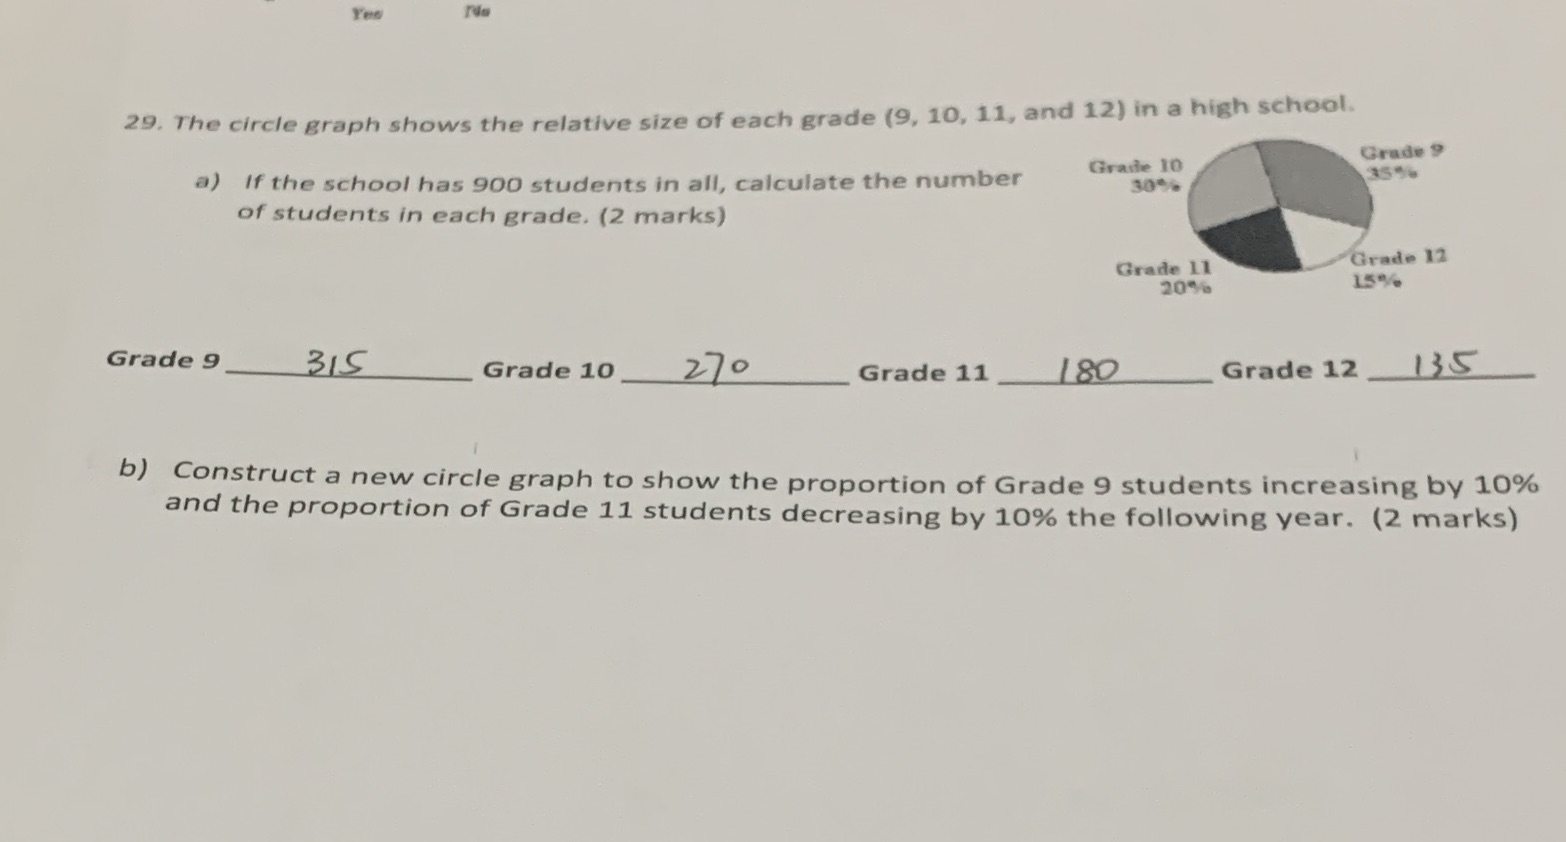
29. The circle graph shows the relative size of each grade (9, 10, 11, and 12) in a high school. Grade ? a) If the
Step by Step Solution
There are 3 Steps involved in it
Step: 1

Get Instant Access to Expert-Tailored Solutions
See step-by-step solutions with expert insights and AI powered tools for academic success
Step: 2

Step: 3
Ace Your Homework with AI
Get the answers you need in no time with our AI-driven, step-by-step assistance
Get Started
Differential Equations A Maple™ Supplement
Authors: Robert P Gilbert, George C Hsiao, Robert J Ronkese
2nd Edition
1000402525, 9781000402520