(2)LUCKY Shoes has decided to produce a new line of Android sneaker shoes in the
following 7 years. The company spent $113,000 for a marketing study for the
introduction of the new line shoes. The marketing study determined that during the
following 7 years, the company would lose sales of 15,000 pairs of its existing
high-priced shoes per year which sell for $700 per pair, and will have sales of its new
cheap sneaker of 90,000 pairs per year. The cheap shoes will sell for $300 per pair
and have variable costs of $100 per pair. The fixed costs for the new line each year
will be $750,000. The plant and equipment required for the new line will cost
$21,000,000 and will be depreciated on a straight-line basis with no salvage value,
which will be proposed to sell for $1,000 000 in the end of the 7th year.
There is no
other expense. The project will also require an increase in net working capital of
20
$1,053,000 that will be returned at the end of the project. The tax rate is 30 percent.
and the cost of capital is 12 percent. Should the corporation accept this project or not
based on NPV?
please help fast
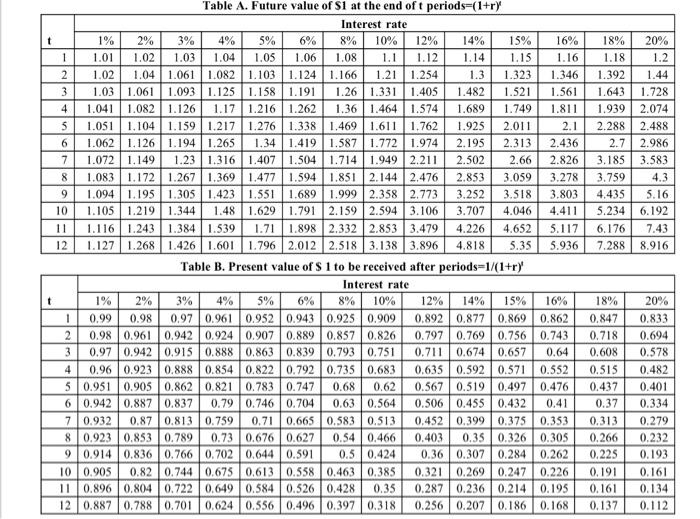
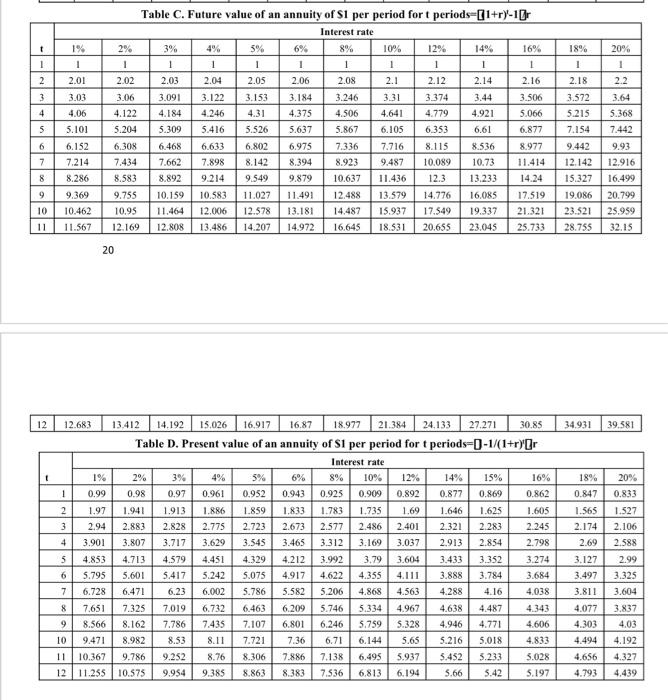
t t 5% 8% 10% 12% 14% 15% 16% 18% 4% 1.04 1.05 6% 1.06 1.08 1.1 1.12 1.14 1.15 1.16 1.18 1.2 1.02 1.04 1.061 1.082 1.103 1.124 1.166 1.21 1.254 1.323 1.346 1.392 1.44 1.3 1.482 1.521 1.561 1.643 1.728 1.811 1.939 2.074 1.03 1.061 1.093 1.125 1.158 1.191 1.26 1.331 1.405 1.041 1.082 1.126 1.17 1.216 1.262 1.36 1.464 1.574 1.689 1.749 1.051 1.104 1.159 1.217 1.276 1.338 1.469 1.611 1.762 1.925 2.011 1.194 1.265 1.34 1.419 1.587 1.772 1.974 2.195 2.313 2.436 2.1 2.288 2.488 1.062 1.126 2.7 2.986 1.072 1.149 2.66 2.826 3.185 3.583 8 1.083 1.172 1.23 1.316 1.407 1.504 1.714 1.949 2.211 2.502 1.267 1.369 1.477 1.594 1.851 2.144 2.476 2.853 3.059 3.278 3.759 4.3 9 1.094 1.195 1.305 1.423 1.551 1.689 1.999 2.358 2.773 3.252 3.518 3.803 4.435 5.16 10 1.105 1.219 1.344 1.48 1.629 1.791 2.159 2.594 3.106 3.707 4.046 4.411 5.234 6.192 11 1.116 1.243 1.384 1.539 1.71 1.898 2.332 2.853 3.479 4.226 4.652 5.117 6.176 7.43 12 1.127 1.268 1.426 1.601 1.796 2.012 2.518 3.138 3.896 4.818 5.35 5.936 7,288 8.916 Table B. Present value of $ 1 to be received after periods=1/(1+r)' 1% 2% 0.99 0.98 0.97 0.98 0.961 0.942 Interest rate 3% 4% 5% 6% 8% 10% 0.961 0.952 0.943 0.925 0.909 0.924 0.907 0.889 0.857 0.826 0.97 0.942 0.915 0.888 0.863 0.839 0.793 0.751 0.96 0.923 0.888 0.854 0.822 0.792 0.735 0.683 0.951 0.905 0.862 0.821 0.783 0.747 0.68 0.62 0.942 0.887 0.837 0.79 0.746 0.704 0.63 0.564 0.932 0.87 0.813 0.759 0.71 0.665 0.583 0.513 8 0.923 0.853 0.789 0.73 0.676 0.627 0.54 0.466 9 0.914 0.836 0.766 0.702 0.644 0.591 0.5 0.424 10 0.905 0.82 0.744 0.675 0.613 0.558 0.463 0.385 11 0.896 0.804 0.722 0.649 0.584 0.526 0.428 0.35 12 0.887 0.788 0.701 0.624 0.556 0.496 0.397 0.318 1 2 3 4 5 6 7 1 2 3 1% 1.01 4 5 6 7 Table A. Future value of S1 at the end of t periods=(1+r) Interest rate 2% 3% 1.02 1.03 12% 14% 15% 16% 18% 0.892 0.877 0.869 0.862 0.847 0.797 0.769 0.756 0.743 0.718 0.711 0.674 0.657 0.64 0.608 0.635 0.592 0.571 0.552 0.515 0.567 0.519 0.497 0.476 0.437 0.506 0.455 0.432 0.41 0.37 0.452 0.399 0.375 0.353 0.313 0.403 0.326 0.305 0.266 0.36 0.307 0.284 0.262 0.225 0.321 0.269 0.247 0.226 0.191 0.287 0.236 0.214 0.195 0.161 0.256 0.207 0.186 0.168 0.137 20% 20% 0.833 0.694 0.578 0.482 0.401 0.334 0.279 0.232 0.193 0.161 0.134 0.112 t 1 2 3 4 5 6 7 8 9 10 12 t 3% 6% 8% 10% 4% 1 1 1 1 1 2.03 2.04 2.06 2.08 2.1 3.06 3.091 3.122 3.153 3.184 3.246 3.31 4.122 4.184 4.31 4.375 4.506 4.641 4.246 5.204 5.309 5.416 5.526 5.637 5.867 7.336 6.308 6.468 6.975 7.434 7.662 8.394 8.923 6.633 6.802 7.898 8.142 8.583 8.892 9.214 9.549 9.879 10.637 9.755 10.159 10.583 11.027 11.491 10.462 10.95 11.464 12.006 12.578 13.181 11.567 12.169 12.808 13.486 14.207 14.972 9.369 1% 1 2.01 3.03 4.06 5.101 6.152 7,214 8.286 12.683 8 9 20 Table C. Future value of an annuity of S1 per period for t periods=1+r)-10 Interest rate 2% 1 2.02 5% I 2.05 1% 2% 1 0.99 0.98 2 1.97 1.941 3 2.94 2.883 4 3.901 5 4.579 4.451 5.417 5.242 6.23 6.002 7.019 6.732 7.786 7.435 8.53 8.11 7.721 11 10.367 9.786 9.252 8.76 8.306 12 11.255 10.575 9.954 9.385 8.863 3.807 4.853 4.713 6 5.795 5.601 7 6.728 6.471 7.651 7.325 8.566 8.162 9.471 8.982 10 3% 4% 0.97 0.961 1.913 1.886 2.828 2.775 3.717 3.629 12% 1 2.12 3.374 3.44 4.779 4.921 14% 1 2.14 13.412 14.192 15.026 16.917 16.87 18.977 21.384 24.133 27.271 30.85 Table D. Present value of an annuity of S1 per period for t periods--1/(1+r)r Interest rate 5% 6% 8% 10% 12% 0.952 0.943 0.925 0.909 0.892 1.859 1.833 1.783 1.735 1.69 2.723 2.673 2.577 2.486 2.401 3.545 3.465 4.329 4.212 4.917 3.312 3.169 3.037 5.075 5.786 5.582 3.992 3.79 4.622 4.355 5.206 4.868 6.463 6.209 5.746 5.334 7.107 6.801 6.246 5.759 14% 15% 0.877 0.869 1.646 1.625 2.321 2.283 2.913 2.854 3.604 3.433 3.352 4.111 3.888 3.784 4.563 4.288 4.16 4.967 4.638 4.487 5.328 4.946 4.771 7.36 6.71 6.144 5.65 5.216 7.886 7.138 6.495 5.937 5.452 8.383 7.536 6.813 6.194 5.018 5.66 16% 1 2.16 3.506 5.066 6.105 6.353 6.877 6.61 8.536 8.977 7.716 8.115 9.487 10.089 10.73 11.414 11.436 12.3 13.233 14.24 12.488 13.579 14.776 16.085 17.519 19.086 20,799 14.487 15.937 17.549 19.337 21.321 23.521 25.959 16.645 18.531 20.655 23.045 25.733 28.755 32.15 3.233 5.42 1.605 2.245 2.798 18% 1 2.18 3.274 3.684 4,038 3.572 5.215 7.154 4.343 4.606 4.833 5.028 5.197 20% 1 2.2 3.64 5.368 7.442 16% 18% 20% 0.862 0.847 0.833 1.565 1.527 2.174 2.106 2.69 2.588 3.127 2.99 3.497 3.325 3.811 3.604 4.077 3.837 4.303 4.03 4.494 4.192 4.656 4.327 4.793 4.439 9442 9.93 12.142 12.916 15.327 16.499 34.931 39.581


