Answered step by step
Verified Expert Solution
Question
1 Approved Answer
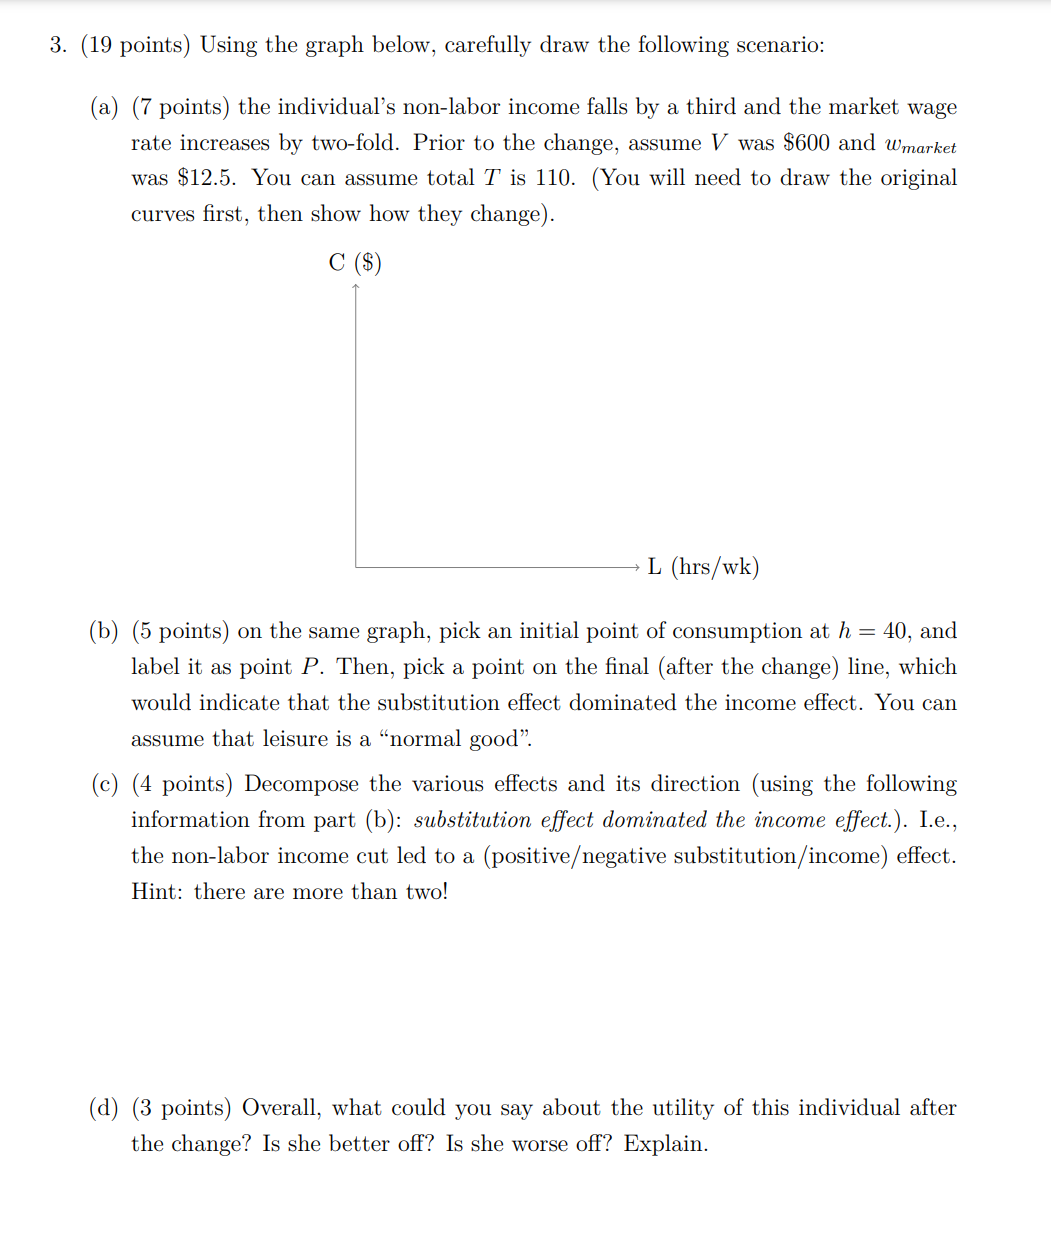
3. (19 points) Using the graph below, carefully draw the following scenario: (a) (7 points) the individual's non-labor income falls by a third and

3. (19 points) Using the graph below, carefully draw the following scenario: (a) (7 points) the individual's non-labor income falls by a third and the market wage rate increases by two-fold. Prior to the change, assume V was $600 and wmarket was $12.5. You can assume total T is 110. (You will need to draw the original curves first, then show how they change). C ($) L (hrs/wk) (b) (5 points) on the same graph, pick an initial point of consumption at h = 40, and label it as point P. Then, pick a point on the final (after the change) line, which would indicate that the substitution effect dominated the income effect. You can assume that leisure is a "normal good". (c) (4 points) Decompose the various effects and its direction (using the following information from part (b): substitution effect dominated the income effect.). I.e., the non-labor income cut led to a (positive/negative substitution/income) effect. Hint: there are more than two! (d) (3 points) Overall, what could you say about the utility of this individual after the change? Is she better off? Is she worse off? Explain.
Step by Step Solution
★★★★★
3.43 Rating (172 Votes )
There are 3 Steps involved in it
Step: 1
a To draw the original and changed scenarios we need to first plot the original budget line and then show how it changes after the given changes in no...
Get Instant Access to Expert-Tailored Solutions
See step-by-step solutions with expert insights and AI powered tools for academic success
Step: 2

Step: 3

Ace Your Homework with AI
Get the answers you need in no time with our AI-driven, step-by-step assistance
Get Started


