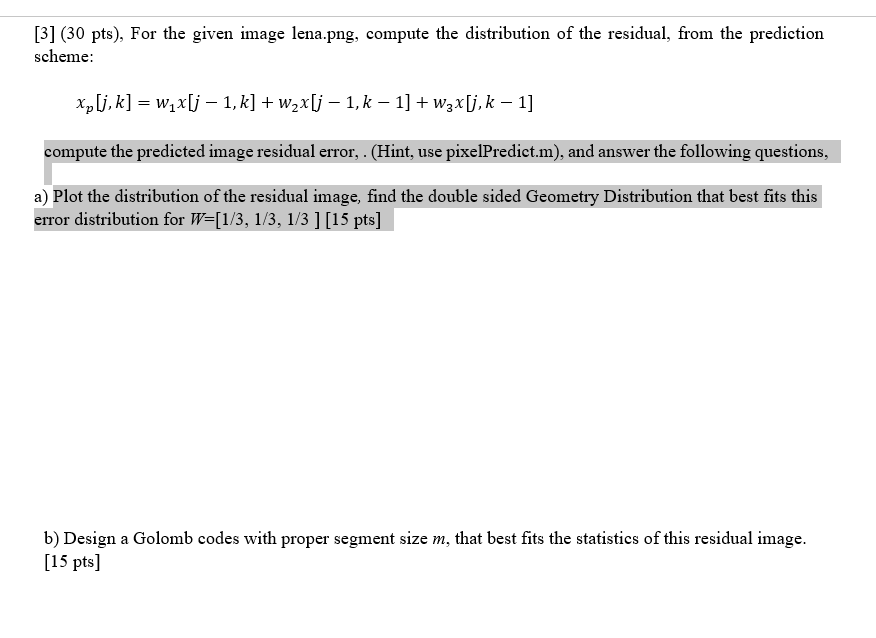
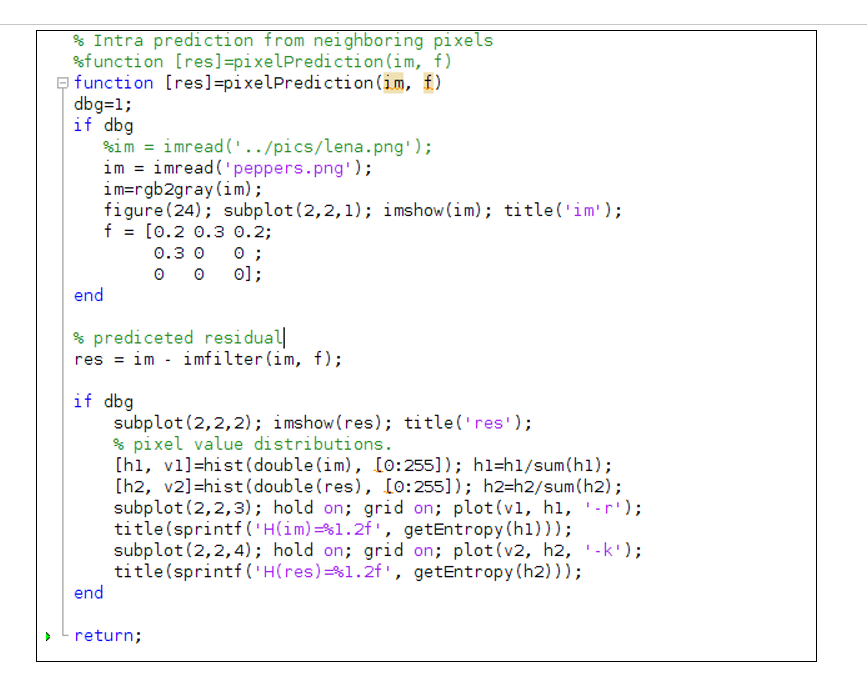
[3] (30 pts), For the given image lena.png, compute the distribution of the residual, from the prediction scheme: xp[j,k] = w x[j 1,k] + w2x[j 1, k 1] + wzx[j, k 1] compute the predicted image residual error, . (Hint, use pixelPredict.m), and answer the following questions, a) Plot the distribution of the residual image, find the double sided Geometry Distribution that best fits this error distribution for W=[1/3, 1/3, 1/3 ] [15 pts] b) Design a Golomb codes with proper segment size m, that best fits the statistics of this residual image. [15 pts] % Intra prediction from neighboring pixels sfunction [res] =pixelPrediction(im, f) 9 function [res]=pixelPrediction (im, f) dbg=1; if dbg %im = imread('../pics/lena.png'); im = imread('peppers.png'); im=rgb2gray(im); figure(24); subplot(2,2,1); imshow(im); title('im'); f = [0.2 0.3 0.2; 0.300; ol; end % prediceted residual res = im - imfilter(im, f); if dbg subplot(2,2,2); imshow(res); title('res'); % pixel value distributions. [hi, vi]=hist(double(im), (0:255]); hl=h1/sum(hi); [h2, V2]=hist(double(res), (0:255]); h2=h2/ sum(h2); subplot(2,2,3); hold on; grid on; plot(vi, hi, '--'); title(sprintf('Him)=1.2f', getEntropy(hi))); subplot(2,2,4); hold on; grid on; plot(v2, h2, '-k'); title(sprintf("H(res)=1.2f', getEntropy (h2))); end return; [3] (30 pts), For the given image lena.png, compute the distribution of the residual, from the prediction scheme: xp[j,k] = w x[j 1,k] + w2x[j 1, k 1] + wzx[j, k 1] compute the predicted image residual error, . (Hint, use pixelPredict.m), and answer the following questions, a) Plot the distribution of the residual image, find the double sided Geometry Distribution that best fits this error distribution for W=[1/3, 1/3, 1/3 ] [15 pts] b) Design a Golomb codes with proper segment size m, that best fits the statistics of this residual image. [15 pts] % Intra prediction from neighboring pixels sfunction [res] =pixelPrediction(im, f) 9 function [res]=pixelPrediction (im, f) dbg=1; if dbg %im = imread('../pics/lena.png'); im = imread('peppers.png'); im=rgb2gray(im); figure(24); subplot(2,2,1); imshow(im); title('im'); f = [0.2 0.3 0.2; 0.300; ol; end % prediceted residual res = im - imfilter(im, f); if dbg subplot(2,2,2); imshow(res); title('res'); % pixel value distributions. [hi, vi]=hist(double(im), (0:255]); hl=h1/sum(hi); [h2, V2]=hist(double(res), (0:255]); h2=h2/ sum(h2); subplot(2,2,3); hold on; grid on; plot(vi, hi, '--'); title(sprintf('Him)=1.2f', getEntropy(hi))); subplot(2,2,4); hold on; grid on; plot(v2, h2, '-k'); title(sprintf("H(res)=1.2f', getEntropy (h2))); end return