Answered step by step
Verified Expert Solution
Question
1 Approved Answer
3 4 5 6 7 8 9 10 11 12 13 14 15 16 17 18 19 20 21 22 23 24 25 26


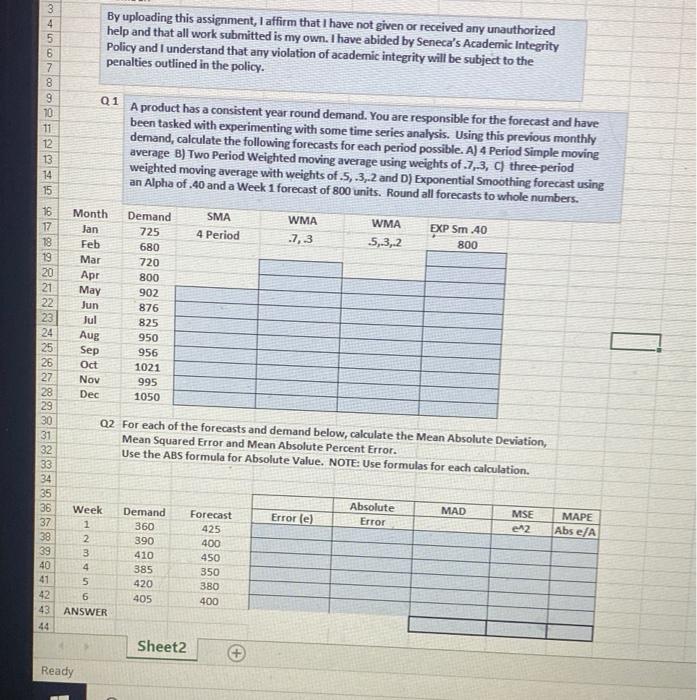
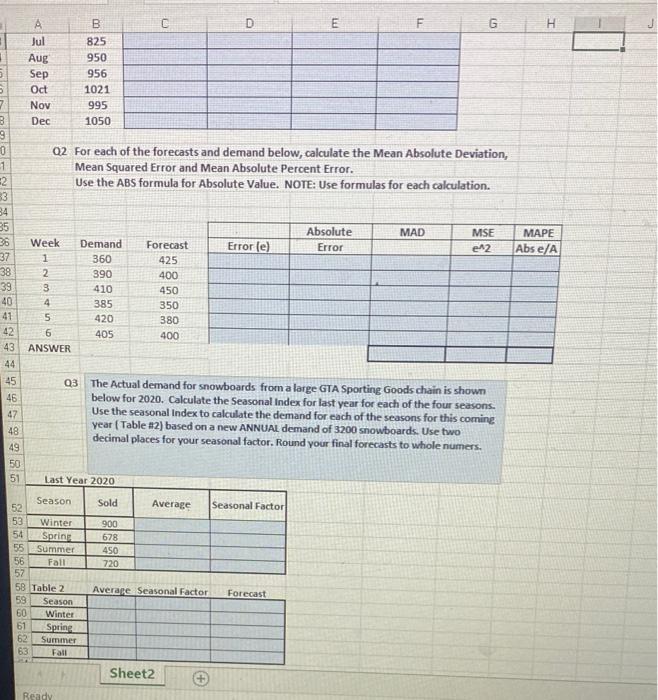
3 4 5 6 7 8 9 10 11 12 13 14 15 16 17 18 19 20 21 22 23 24 25 26 27 28 29 30 31 32 33 34 35 858895 36 37 38 39 40 Month Jan Feb Mar Q1 A product has a consistent year round demand. You are responsible for the forecast and have been tasked with experimenting with some time series analysis. Using this previous monthly demand, calculate the following forecasts for each period possible. A) 4 Period Simple moving average B) Two Period Weighted moving average using weights of .7,3, C) three-period weighted moving average with weights of .5, .3,.2 and D) Exponential Smoothing forecast using an Alpha of .40 and a Week 1 forecast of 800 units. Round all forecasts to whole numbers. Apr May Jun Jul Ready Aug Sep Oct Nov Dec Week 123456 By uploading this assignment, I affirm that I have not given or received any unauthorized help and that all work submitted is my own. I have abided by Seneca's Academic Integrity Policy and I understand that any violation of academic integrity will be subject to the penalties outlined in the policy. 41 42 6 43 ANSWER 44 Demand 725 680 720 800 902 876 825 950 956 1021 995 1050 Demand 360 390 410 385 420 405 SMA 4 Period Q2 For each of the forecasts and demand below, calculate the Mean Absolute Deviation, Mean Squared Error and Mean Absolute Percent Error. Use the ABS formula for Absolute Value. NOTE: Use formulas for each calculation. Sheet2 Forecast 425 400 450 WMA 7,3 350 380 400 WMA 5,3,2 Error (e) EXP Sm .40 800 Absolute Error MAD MSE e^2 MAPE Abs e/A 5 5 7 B 9 0 1 2 83 34 35 36 37 38 39 40 41 42 43 44 839888388283 2868465 A Jul Aug Sep Oct Nov Dec 62 Week 1234in 5 6 ANSWER 03 Season Winter Spring 55 Summer Fall Q2 For each of the forecasts and demand below, calculate the Mean Absolute Deviation, Mean Squared Error and Mean Absolute Percent Error. Use the ABS formula for Absolute Value. NOTE: Use formulas for each calculation. 58 Table 2 Last Year 2020 Sold 900 678 Season B 825 950 956 1021 995 1050 Winter Spring Summer Fall Ready Demand 360 390 410 385 420 405 Forecast 425 400 450 720 D 450 350 380 400 Error (e) Sheet2 Average Seasonal Factor E Average Seasonal Factor Forecast F Absolute Error The Actual demand for snowboards from a large GTA Sporting Goods chain is shown below for 2020. Calculate the Seasonal Index for last year for each of the four seasons. Use the seasonal Index to calculate the demand for each of the seasons for this coming year (Table #2) based on a new ANNUAL demand of 3200 snowboards. Use two decimal places for your seasonal factor. Round your final forecasts to whole numers. G MAD MSE e^2 H MAPE Abs e/A
Step by Step Solution
There are 3 Steps involved in it
Step: 1

Get Instant Access to Expert-Tailored Solutions
See step-by-step solutions with expert insights and AI powered tools for academic success
Step: 2

Step: 3

Ace Your Homework with AI
Get the answers you need in no time with our AI-driven, step-by-step assistance
Get Started


