Answered step by step
Verified Expert Solution
Question
1 Approved Answer
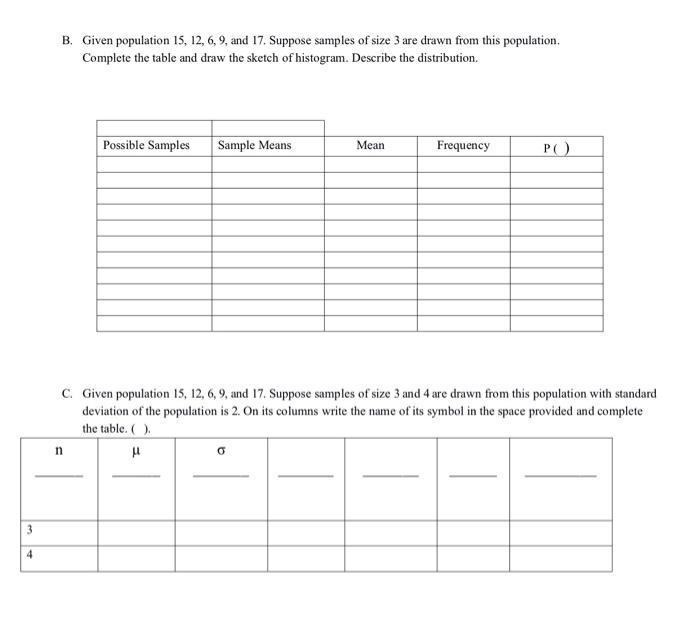
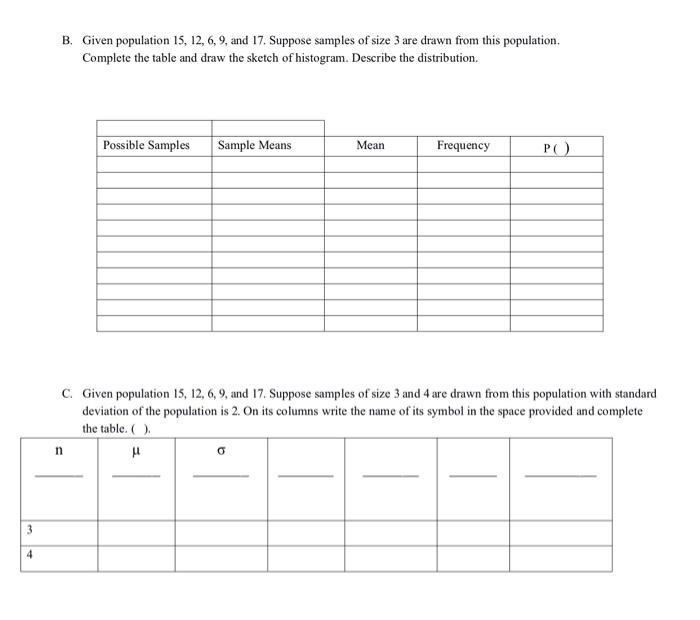
3 4 B. Given population 15, 12, 6, 9, and 17. Suppose samples of size 3 are drawn from this population. Complete the table


3 4 B. Given population 15, 12, 6, 9, and 17. Suppose samples of size 3 are drawn from this population. Complete the table and draw the sketch of histogram. Describe the distribution. Possible Samples n Sample Means Mean O Frequency C. Given population 15, 12, 6, 9, and 17. Suppose samples of size 3 and 4 are drawn from this population with standard deviation of the population is 2. On its columns write the name of its symbol in the space provided and complete the table. ( ). P() (Items 24-50) show your solutions clearly and legibly on the space provided. A. The average cost per household of owning a brand new car is 5,000. Suppose that we randomly selected 40 households. Determine the probability that the sample mean for these 40 households is more than 5,350? Assume the variable is normally distributed and the standard deviation is 1,230. 3 4 B. Given population 15, 12, 6, 9, and 17. Suppose samples of size 3 are drawn from this population. Complete the table and draw the sketch of histogram. Describe the distribution. Possible Samples n Sample Means Mean O Frequency C. Given population 15, 12, 6, 9, and 17. Suppose samples of size 3 and 4 are drawn from this population with standard deviation of the population is 2. On its columns write the name of its symbol in the space provided and complete the table. ( ). P()
Step by Step Solution
★★★★★
3.55 Rating (155 Votes )
There are 3 Steps involved in it
Step: 1
Answer Answe r A The probability statement is PX5350 The probability that the samp...
Get Instant Access to Expert-Tailored Solutions
See step-by-step solutions with expert insights and AI powered tools for academic success
Step: 2

Step: 3

Ace Your Homework with AI
Get the answers you need in no time with our AI-driven, step-by-step assistance
Get Started


