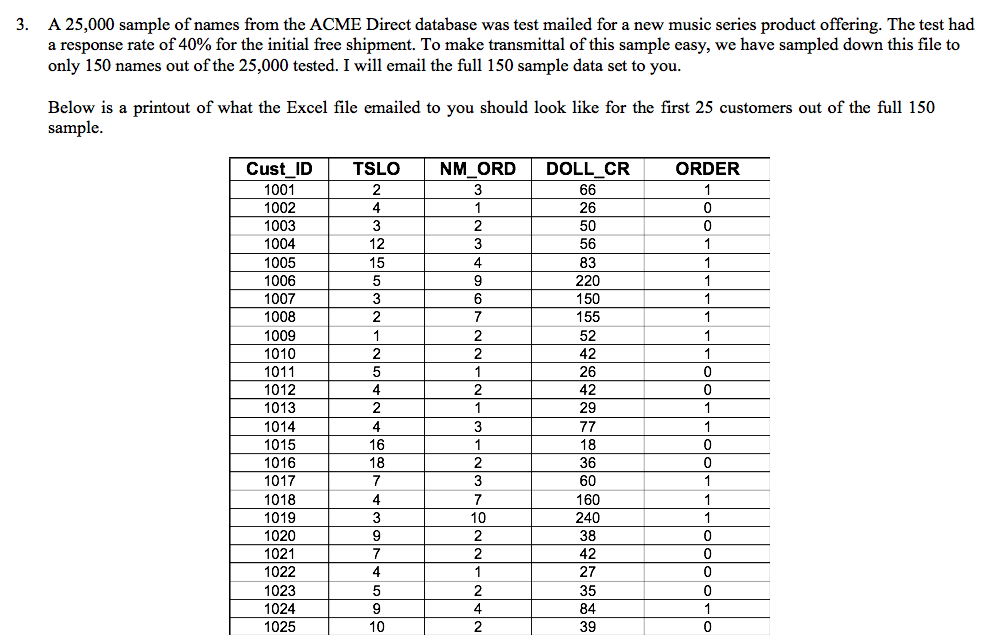
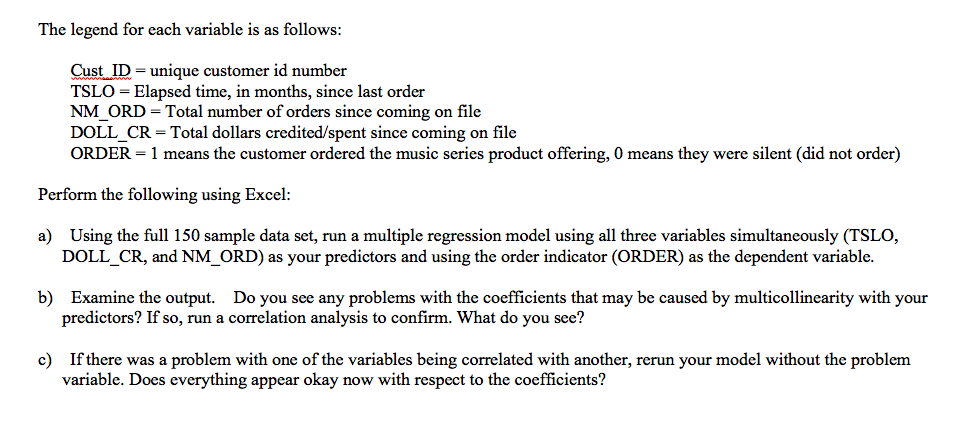
3. A 25,000 sample of names from the ACME Direct database was test mailed for a new music series product offering. The test had a response rate of 40% for the initial free shipment. To make transmittal of this sample easy, we have sampled down this file to only 150 names out of the 25,000 tested. I will email the full 150 sample data set to you. Below is a printout of what the Excel file emailed to you should look like for the first 25 customers out of the full 150 sample. TSLO NM_ORD DOLL_CR ORDER 66 26 50 56 83 220 150 155 52 1 1 Cust_ID 1001 1002 1003 1004 1005 1006 1007 1008 1009 1010 1011 1012 1013 1014 1015 1016 1017 1018 1019 1020 1021 1022 1023 1024 1025 18 0 O 36 60 160 240 38 42 27 The legend for each variable is as follows: Cust ID = unique customer id number TSLO - Elapsed time, in months, since last order NM ORD - Total number of orders since coming on file DOLL CR = Total dollars credited/spent since coming on file ORDER = 1 means the customer ordered the music series product offering, 0 means they were silent (did not order) Perform the following using Excel: a) Using the full 150 sample data set, run a multiple regression model using all three variables simultaneously (TSLO, DOLL_CR, and NM_ORD) as your predictors and using the order indicator (ORDER) as the dependent variable. b) Examine the output. Do you see any problems with the coefficients that may be caused by multicollinearity with your predictors? If so, run a correlation analysis to confirm. What do you see? c) If there was a problem with one of the variables being correlated with another, rerun your model without the problem variable. Does everything appear okay now with respect to the coefficients? 3. A 25,000 sample of names from the ACME Direct database was test mailed for a new music series product offering. The test had a response rate of 40% for the initial free shipment. To make transmittal of this sample easy, we have sampled down this file to only 150 names out of the 25,000 tested. I will email the full 150 sample data set to you. Below is a printout of what the Excel file emailed to you should look like for the first 25 customers out of the full 150 sample. TSLO NM_ORD DOLL_CR ORDER 66 26 50 56 83 220 150 155 52 1 1 Cust_ID 1001 1002 1003 1004 1005 1006 1007 1008 1009 1010 1011 1012 1013 1014 1015 1016 1017 1018 1019 1020 1021 1022 1023 1024 1025 18 0 O 36 60 160 240 38 42 27 The legend for each variable is as follows: Cust ID = unique customer id number TSLO - Elapsed time, in months, since last order NM ORD - Total number of orders since coming on file DOLL CR = Total dollars credited/spent since coming on file ORDER = 1 means the customer ordered the music series product offering, 0 means they were silent (did not order) Perform the following using Excel: a) Using the full 150 sample data set, run a multiple regression model using all three variables simultaneously (TSLO, DOLL_CR, and NM_ORD) as your predictors and using the order indicator (ORDER) as the dependent variable. b) Examine the output. Do you see any problems with the coefficients that may be caused by multicollinearity with your predictors? If so, run a correlation analysis to confirm. What do you see? c) If there was a problem with one of the variables being correlated with another, rerun your model without the problem variable. Does everything appear okay now with respect to the coefficients