Answered step by step
Verified Expert Solution
Link Copied!

Question

1 Approved Answer

3. A break even chart is a chart that shows the sales volume level at which total costs equal sales. Required to: Provide your own

image text in transcribed
3. "A break even chart is a chart that shows the sales volume level at which total costs equal sales." Required to: Provide your own data and construct a Break even chart and find the Break-even point in units and in Omani rials. 30 marks

Step by Step Solution

There are 3 Steps involved in it

Step: 1

blur-text-image

Get Instant Access to Expert-Tailored Solutions

See step-by-step solutions with expert insights and AI powered tools for academic success

Step: 2

blur-text-image

Step: 3

blur-text-image

Ace Your Homework with AI

Get the answers you need in no time with our AI-driven, step-by-step assistance

Get Started

Recommended Textbook for

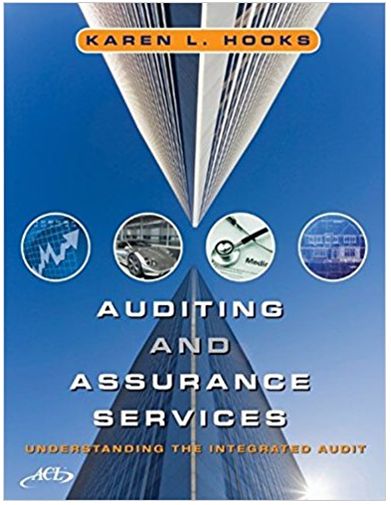
Auditing and Assurance Services Understanding the Integrated Audit

Authors: Karen L. Hooks

1st edition

471726346, 978-0471726340

More Books

Students also viewed these Accounting questions