Answered step by step
Verified Expert Solution
Link Copied!

Question

1 Approved Answer

3. A consumer group conducted a study of SUV owners to estimate the mean fuel mileage for their vehicles. A simple random sample of 90

image text in transcribedimage text in transcribedimage text in transcribed
3. A consumer group conducted a study of SUV owners to estimate the mean fuel mileage for their vehicles. A simple random sample of 90 SUV owners was selected and the owners were asked to report their highway mileage. The sample mean is 18.8 mpg and the sample standard deviation is 5.9 mpg. (a) Using this sample information, construct a 95% confidence interval for the mean highway mileage of SUVs in the population. (b) The group wishes to test whether the population mean is equal to 20 mpg. Construct and conduct an appropriate hypothesis test for addressing this question. Use a 5% level of significance. (c) Redo part (b) using a 10% level of significance. (d) Explain any differences between your responses in parts (b) and (c).1. Open the data set \"monthly\" within Minitab, or 'cut and paste' the data into Minitab. (a) Create the following new variables: InclOOO = Income*1000 Food100=F00d* 100 FoodRatio = FooleOtInclOOO (b) Create a new variable that runs sequentially from 1 to 19 and call it Time. (0) Calculate and report descriptive statistics for each of the variables in your dataset including those you created. Specically, calculate the mean, standard deviation, minimunu maximum, total number of observations and the median. (d) Construct and report a graph (scatterplot) of Income (on the y-axis) and Food (on the x-axis). (e) Construct and report a graph (time series plot) of FoodRatio (on the yaxis) over time (on the x-axis). 2. Use Minitab's graphing tools (Probability Distribution Plot) to illustrate the relationship between the Standard Normal distribution and Student '3 t distribution. Experiment with different values for the degrees of freedom in the t distribution. When is the t distribution a closer approximation to the Standard Norma! distribution?

Step by Step Solution

There are 3 Steps involved in it

Step: 1

blur-text-image

Get Instant Access to Expert-Tailored Solutions

See step-by-step solutions with expert insights and AI powered tools for academic success

Step: 2

blur-text-image_2

Step: 3

blur-text-image_3

Ace Your Homework with AI

Get the answers you need in no time with our AI-driven, step-by-step assistance

Get Started

Recommended Textbook for

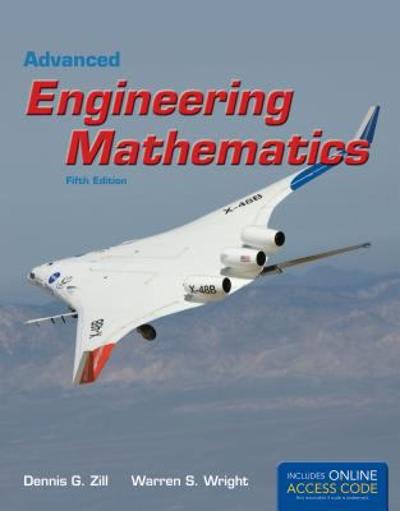
Advanced Engineering Mathematics

Authors: Dennis G Zill, Warren S Wright

5th Edition

1449679781, 9781449679781

More Books

Students also viewed these Mathematics questions