

Answered step by step
Verified Expert Solution
Question
1 Approved Answer
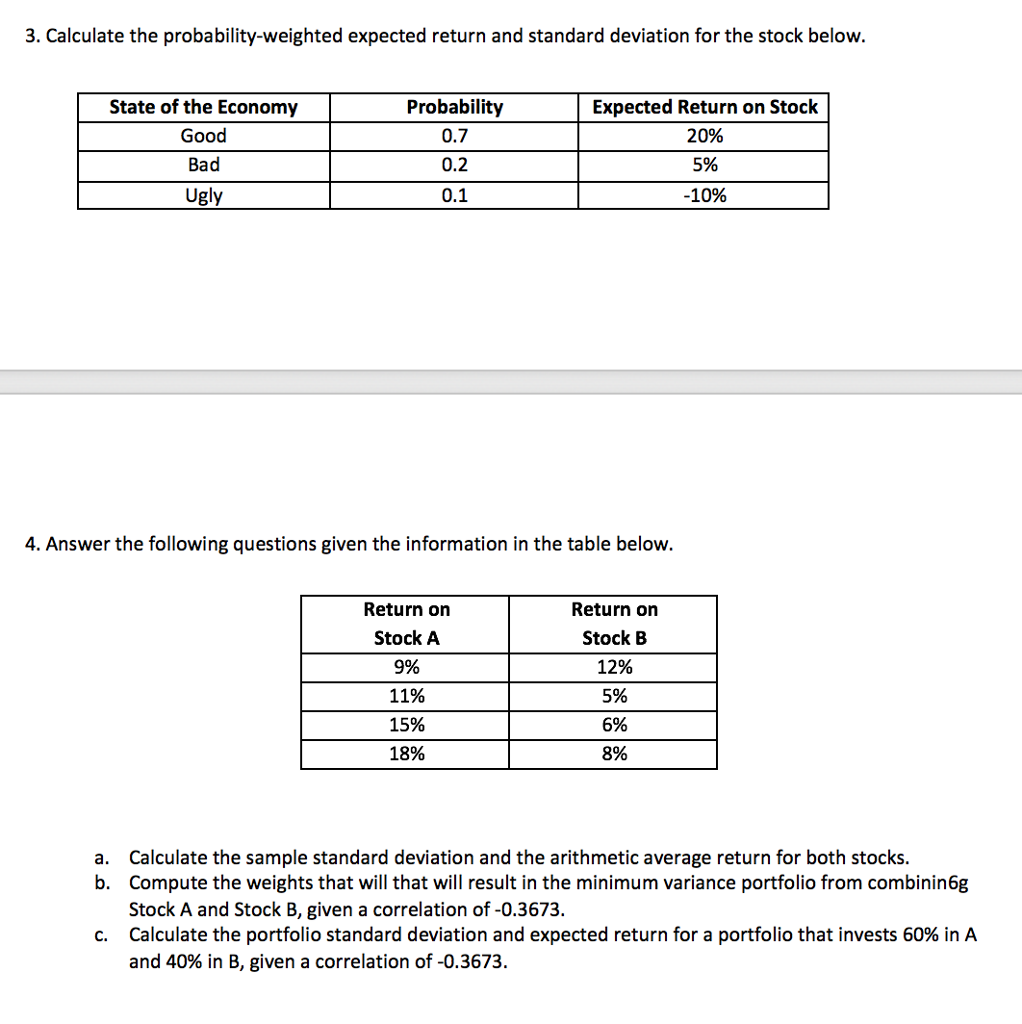
3. Calculate the probability-weighted expected return and standard deviation for the stock below. State of the Economy Good Bad Ugly Probability 0.7 0.2 0.1 Expected
Step by Step Solution
There are 3 Steps involved in it
Step: 1

Get Instant Access to Expert-Tailored Solutions
See step-by-step solutions with expert insights and AI powered tools for academic success
Step: 2

Step: 3
Ace Your Homework with AI
Get the answers you need in no time with our AI-driven, step-by-step assistance
Get Started
How To Read A Financial Report Wringing Vital Signs Out Of The Numbers
Authors: John A. Tracy , Tage C. Tracy
9th Edition
1119606462,1119606489