Answered step by step
Verified Expert Solution
Question
1 Approved Answer
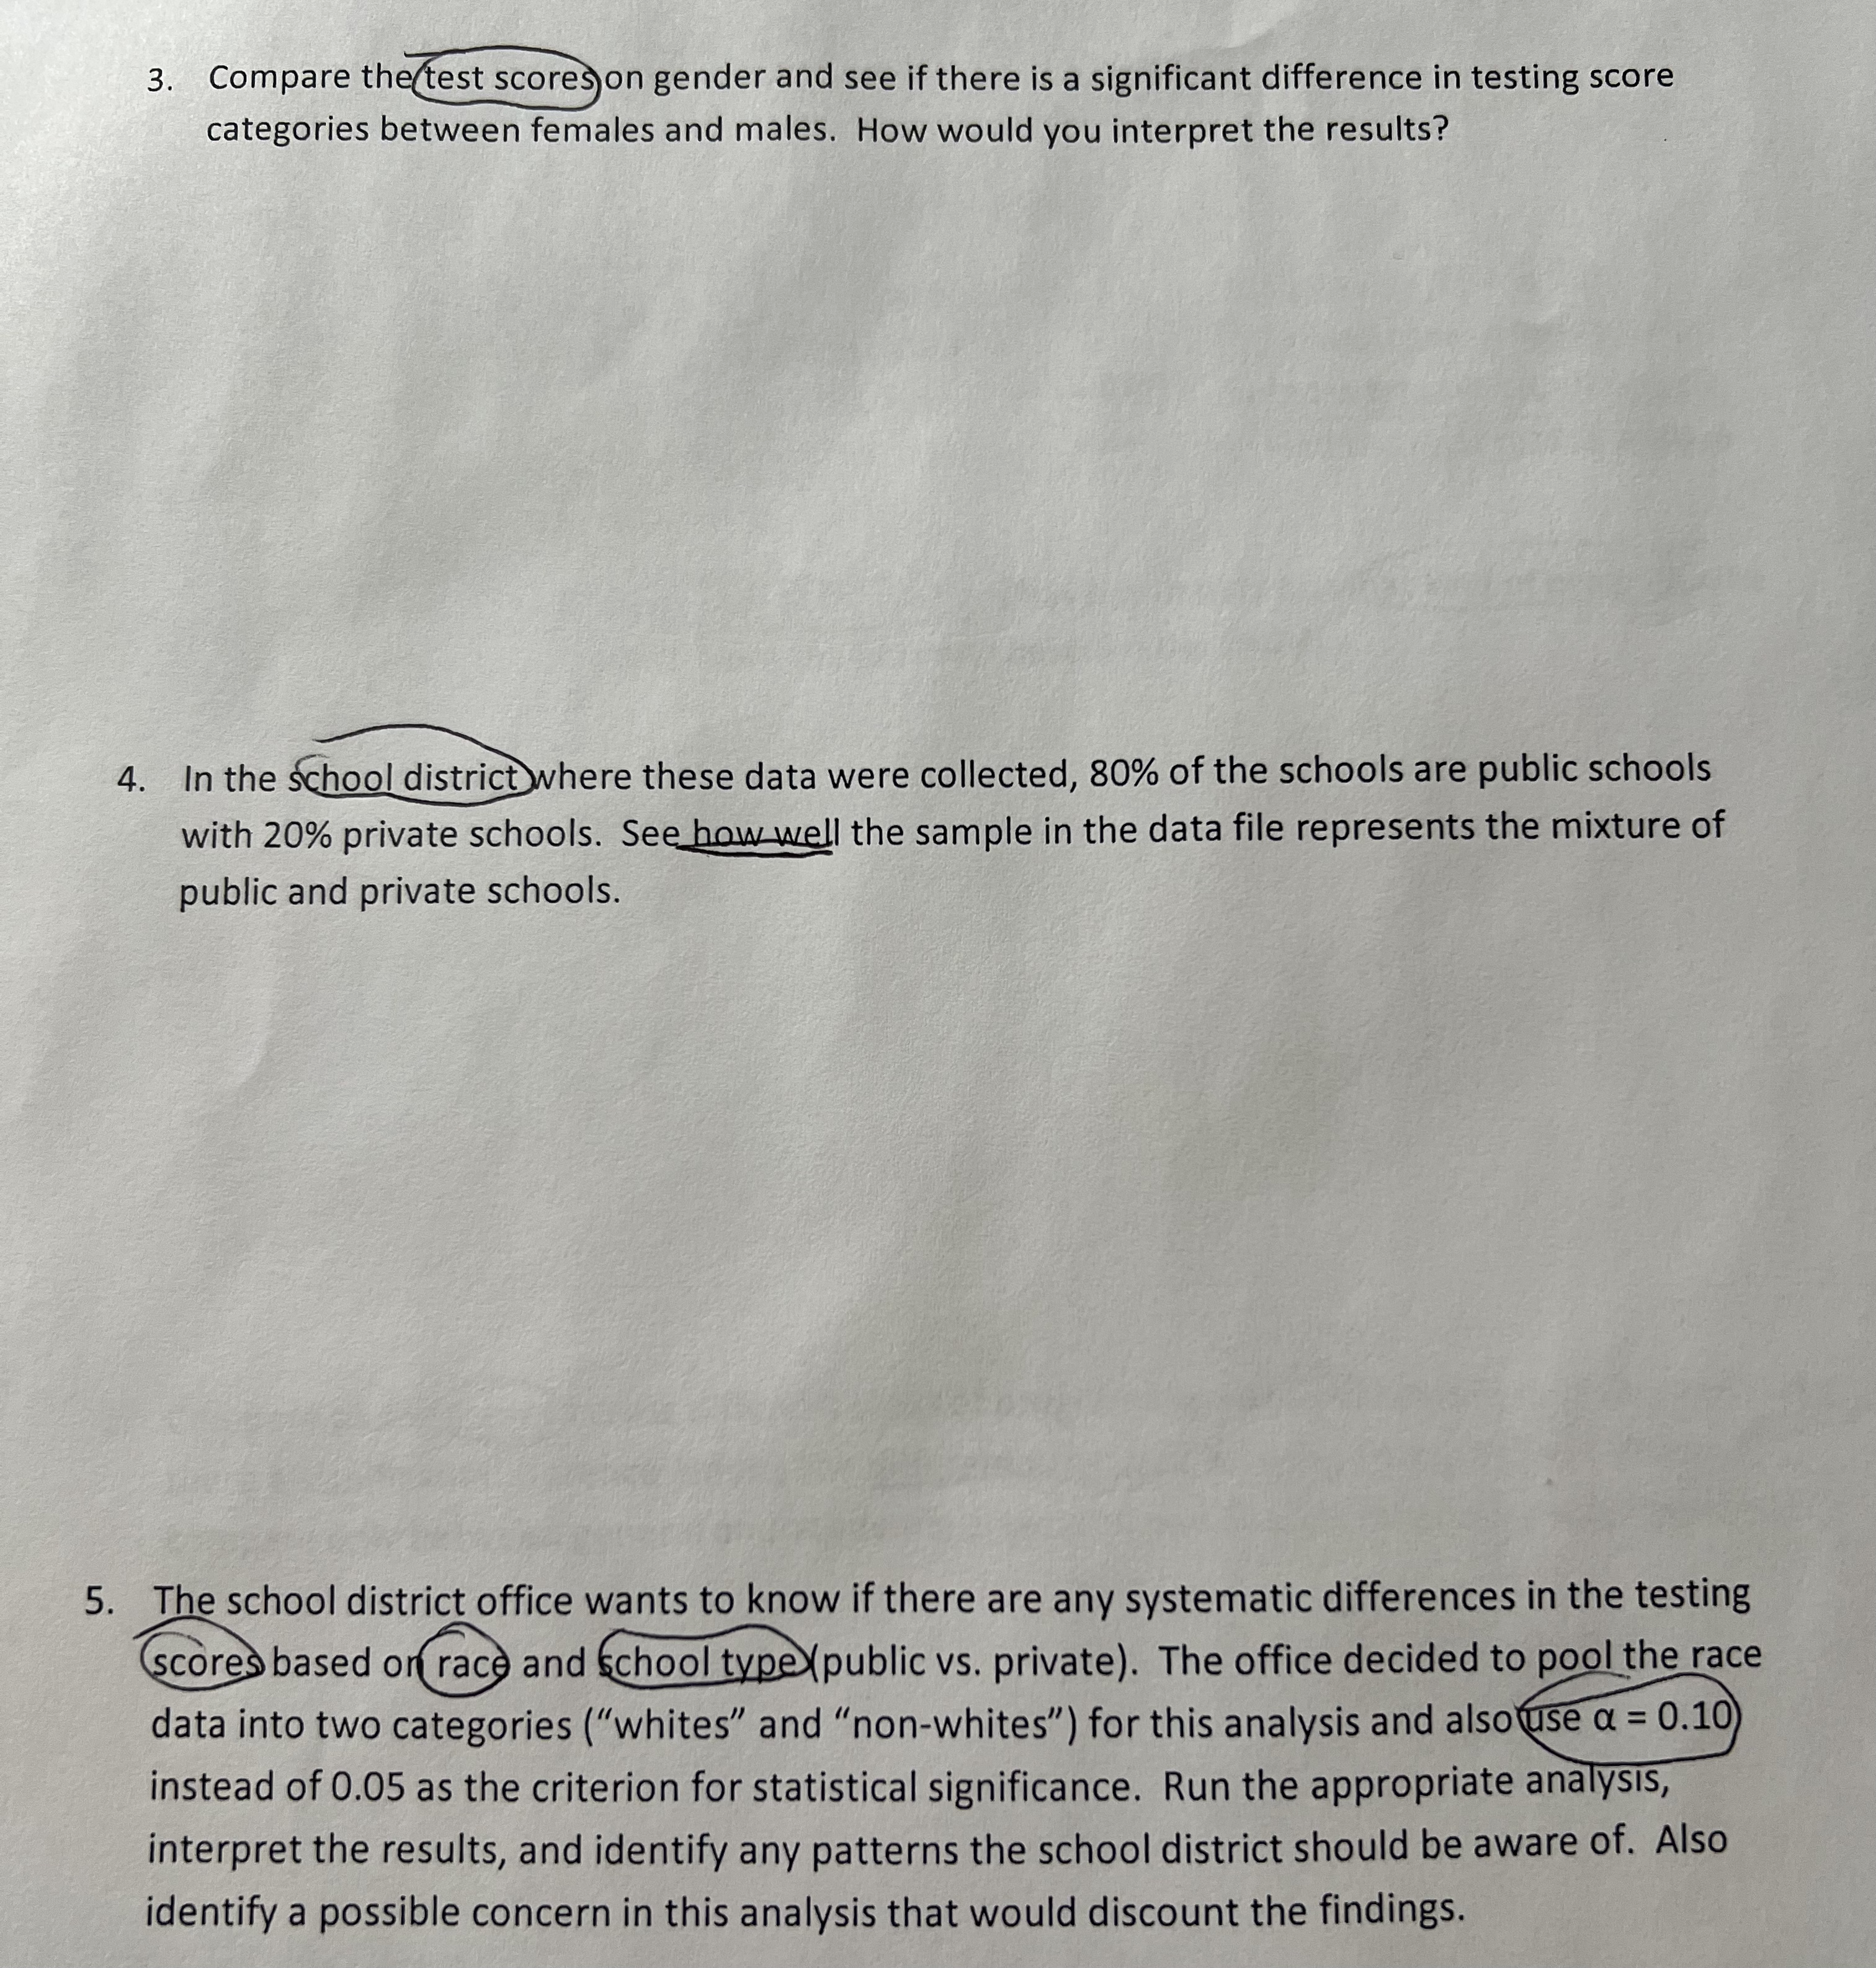
3. Compare the test scores on gender and see if there is a significant difference in testing score categories between females and males. How


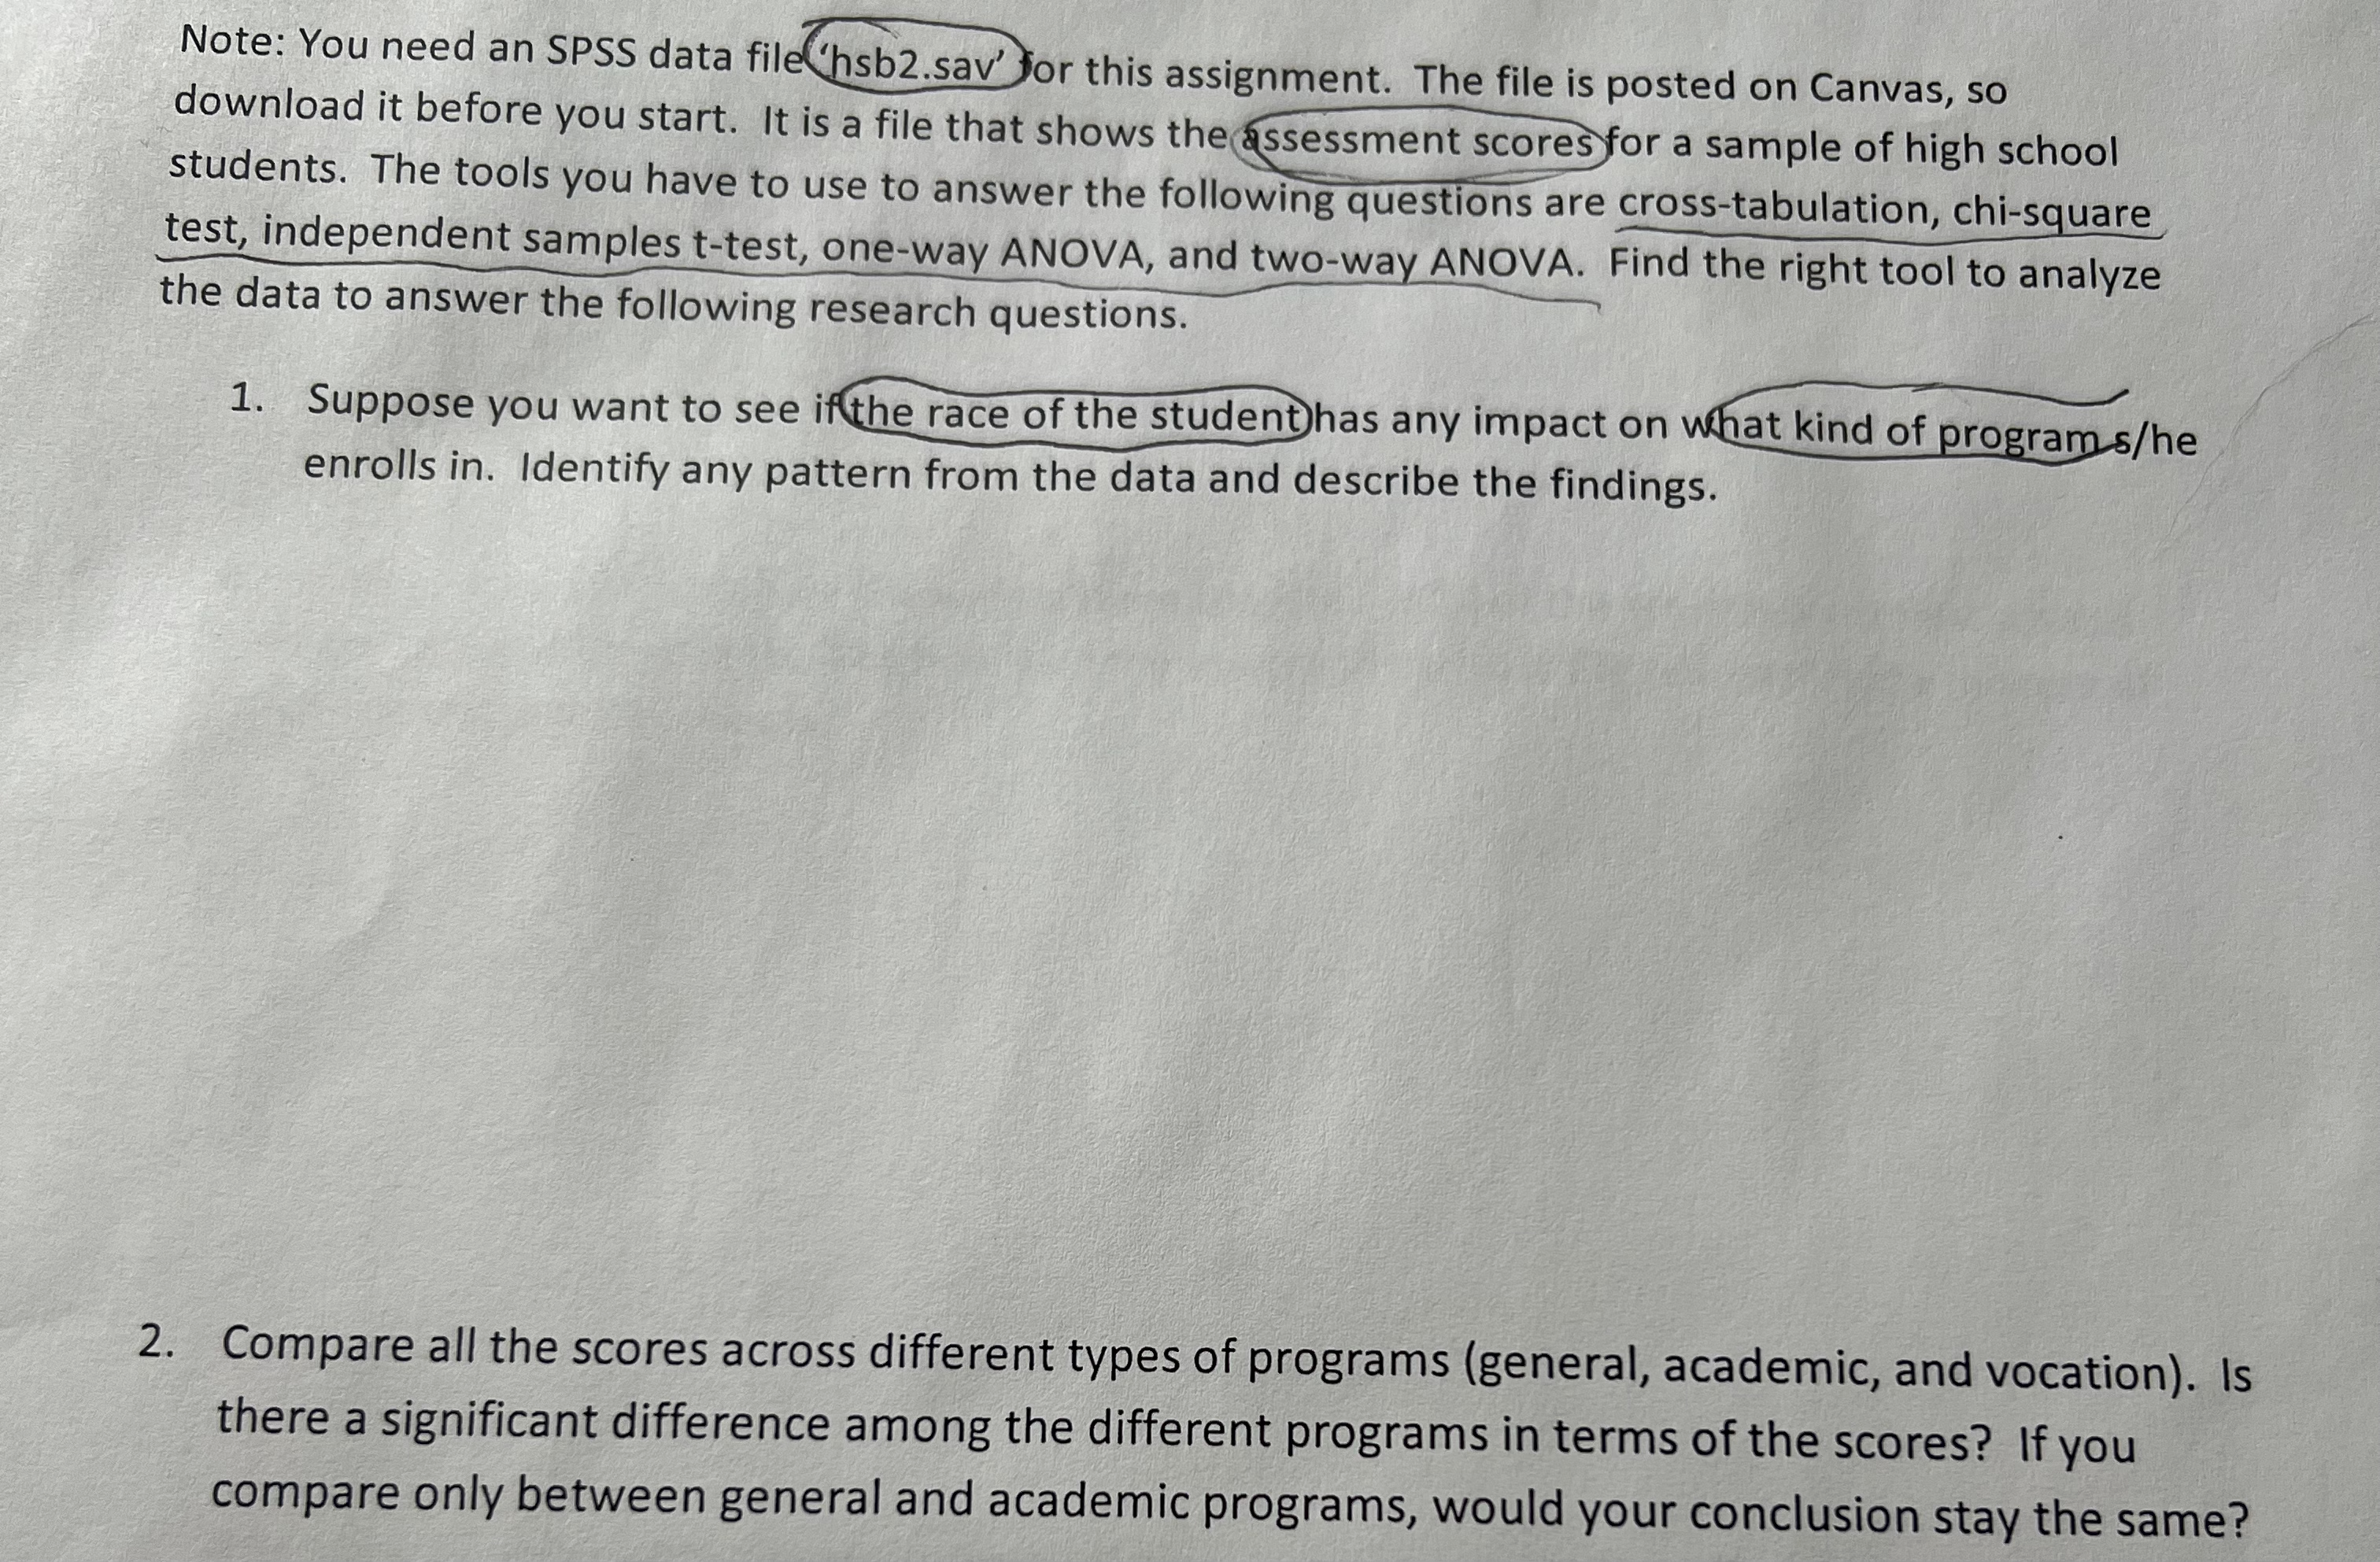
3. Compare the test scores on gender and see if there is a significant difference in testing score categories between females and males. How would you interpret the results? 4. In the school district where these data were collected, 80% of the schools are public schools with 20% private schools. See how well the sample in the data file represents the mixture of public and private schools. 5. The school district office wants to know if there are any systematic differences in the testin scores based on race and school type public vs. private). The office decided to pool the race data into two categories ("whites" and "non-whites") for this analysis and also use a = 0.10) instead of 0.05 as the criterion for statistical significance. Run the appropriate analysis, interpret the results, and identify any patterns the school district should be aware of. Also identify a possible concern in this analysis that would discount the findings. Note: You need an SPSS data file hsb2.sav' for this assignment. The file is posted on Canvas, so download it before you start. It is a file that shows the assessment scores for a sample of high school students. The tools you have to use to answer the following questions are cross-tabulation, chi-square test, independent samples t-test, one-way ANOVA, and two-way ANOVA. Find the right tool to analyze the data to answer the following research questions. 1. Suppose you want to see if the race of the student has any impact on what kind of program s/he enrolls in. Identify any pattern from the data and describe the findings. 2. Compare all the scores across different types of programs (general, academic, and vocation). Is there a significant difference among the different programs in terms of the scores? If you compare only between general and academic programs, would your conclusion stay the same?
Step by Step Solution
★★★★★
3.41 Rating (151 Votes )
There are 3 Steps involved in it
Step: 1
Answer To answer these questions youll need to perform various statistical analyses using SPSS Lets go through each question and outline the appropria...
Get Instant Access to Expert-Tailored Solutions
See step-by-step solutions with expert insights and AI powered tools for academic success
Step: 2

Step: 3

Ace Your Homework with AI
Get the answers you need in no time with our AI-driven, step-by-step assistance
Get Started


