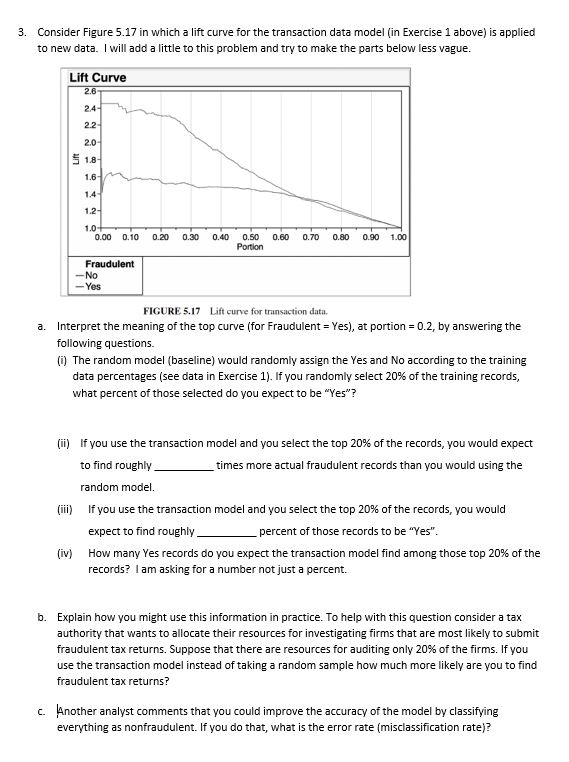
3. Consider Figure 5.17 in which a lift curve for the transaction data model (in Exercise1 above) is applied to new data. I will add a little to this problem and try to make the parts below less vague. Lift Curve 2.6 2.4 2.2 2.0 1.8 1.6 1.0 0.00 0.10 0.20 0.30 0.40 0.50 0.60 0.70 0.80 0.90 1.00 Portion Fraudulent -No -Yes FIGURE 5.17 Lift curve for transaction data. a. Interpret the meaning of the top curve (for Fraudulent Yes), at portion 0.2, by answering the following questions. (i) The random model (baseline) would randomly assign the Yes and No according to the training data percentages (see data in Exercise 1). If you randomly select 20% of the training records, what percent of those selected do you expect to be "Yes"? (ii) lf you use the transaction model and you select the top 20% of the records, you would expect to find roughly random model times more actual fraudulent records than you would using the (iii) If you use the transaction model and you select the top 20% of the records, you would expect to find roughlype How many Yes records do you expect the transaction model find among those top 20% of the records? I am asking for a number not just a percent. percent of those records to be "Yes" (iv) b. Explain how you might use this information in practice. To help with this question consider a tax authority that wants to allocate their resources for investigating firms that are most likely to submit fraudulent tax returns. Suppose that there are resources for auditing only 20% of the firms. If you use the transaction model instead of taking a random sample how much more likely are you to find fraudulent tax returns? Another analyst comments that you could improve the accuracy of the model by classifying everything as nonfraudulent. If you do that, what is the error rate (misclassification rate)? C. 3. Consider Figure 5.17 in which a lift curve for the transaction data model (in Exercise1 above) is applied to new data. I will add a little to this problem and try to make the parts below less vague. Lift Curve 2.6 2.4 2.2 2.0 1.8 1.6 1.0 0.00 0.10 0.20 0.30 0.40 0.50 0.60 0.70 0.80 0.90 1.00 Portion Fraudulent -No -Yes FIGURE 5.17 Lift curve for transaction data. a. Interpret the meaning of the top curve (for Fraudulent Yes), at portion 0.2, by answering the following questions. (i) The random model (baseline) would randomly assign the Yes and No according to the training data percentages (see data in Exercise 1). If you randomly select 20% of the training records, what percent of those selected do you expect to be "Yes"? (ii) lf you use the transaction model and you select the top 20% of the records, you would expect to find roughly random model times more actual fraudulent records than you would using the (iii) If you use the transaction model and you select the top 20% of the records, you would expect to find roughlype How many Yes records do you expect the transaction model find among those top 20% of the records? I am asking for a number not just a percent. percent of those records to be "Yes" (iv) b. Explain how you might use this information in practice. To help with this question consider a tax authority that wants to allocate their resources for investigating firms that are most likely to submit fraudulent tax returns. Suppose that there are resources for auditing only 20% of the firms. If you use the transaction model instead of taking a random sample how much more likely are you to find fraudulent tax returns? Another analyst comments that you could improve the accuracy of the model by classifying everything as nonfraudulent. If you do that, what is the error rate (misclassification rate)? C