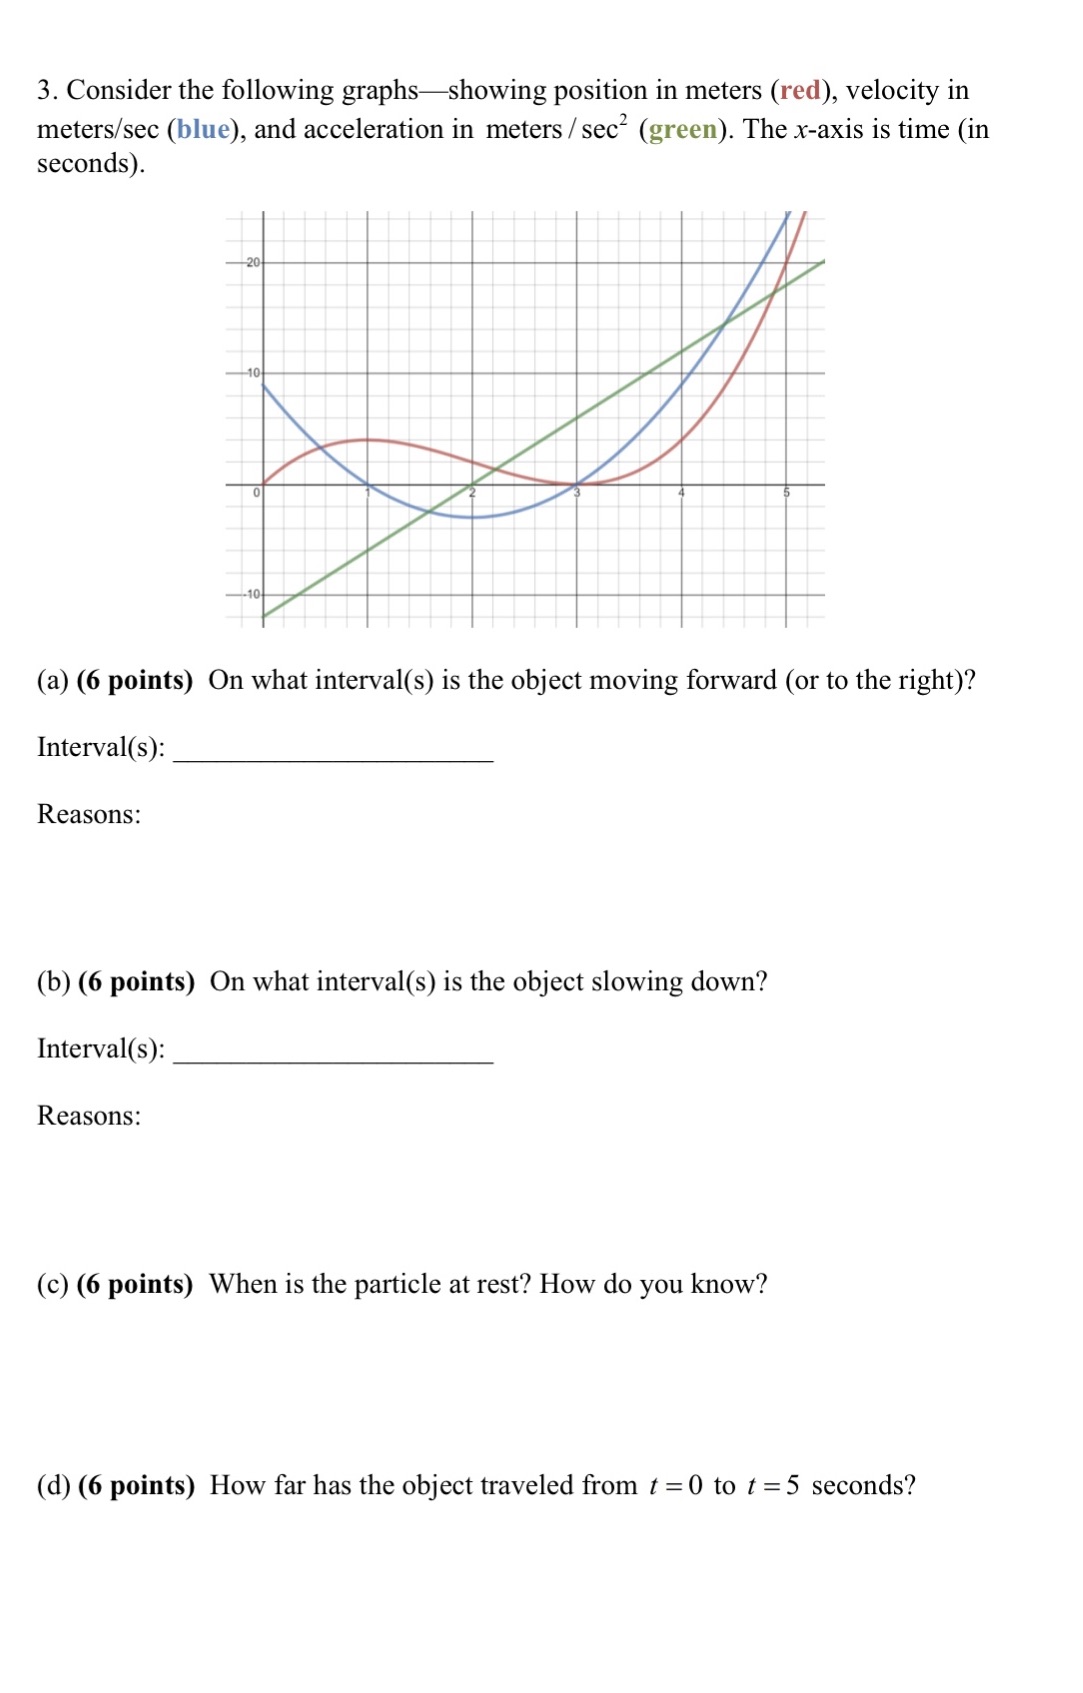
3. Consider the following graphsshowing position in meters (red), velocity in meters/sec (blue), and acceleration in meters/sec (green). The x-axis is time (in seconds).

3. Consider the following graphsshowing position in meters (red), velocity in meters/sec (blue), and acceleration in meters/sec (green). The x-axis is time (in seconds). (a) (6 points) On what interval(s) is the object moving forward (or to the right)? Interval(s): Reasons: (b) (6 points) On what interval(s) is the object slowing down? Interval(s): Reasons: (c) (6 points) When is the particle at rest? How do you know? (d) (6 points) How far has the object traveled from t = 0 to t = 5 seconds?
Step by Step Solution
There are 3 Steps involved in it
Step: 1
Solutions Step 1 All Answers 1 The green curve is velocity ...
See step-by-step solutions with expert insights and AI powered tools for academic success
Step: 2

Step: 3

Ace Your Homework with AI
Get the answers you need in no time with our AI-driven, step-by-step assistance
Get Started


