

Answered step by step
Verified Expert Solution
Question
1 Approved Answer
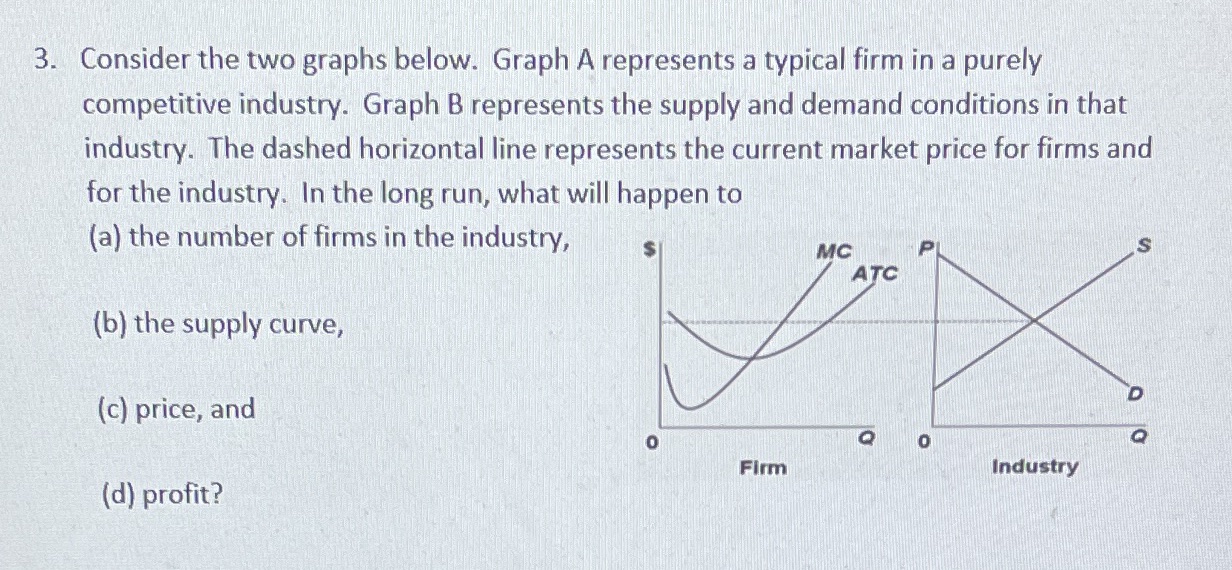
3. Consider the two graphs below. Graph A represents a typical firm in a purely competitive industry. Graph B represents the supply and demand conditions

Step by Step Solution
There are 3 Steps involved in it
Step: 1

Get Instant Access to Expert-Tailored Solutions
See step-by-step solutions with expert insights and AI powered tools for academic success
Step: 2

Step: 3
Ace Your Homework with AI
Get the answers you need in no time with our AI-driven, step-by-step assistance
Get Started
Strategic Management And Business Policy: Globalization, Innovation And Sustainability
Authors: Thomas L. Wheelen, J. David Hunger, Alan N. Hoffman, Chuck Bamford
14th Edition
0133126145, 978-0133126143