Question
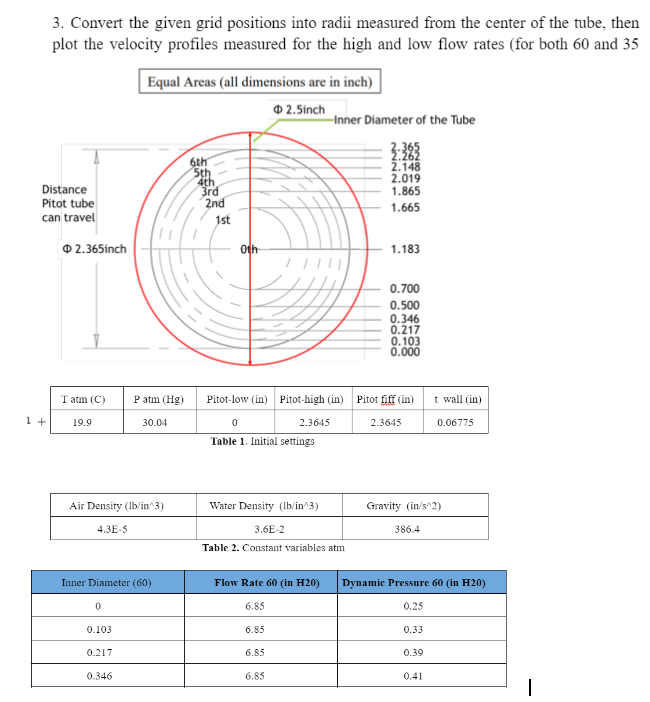
3. Convert the given grid positions into radii measured from the center of the tube, then plot the velocity profiles measured for the high

3. Convert the given grid positions into radii measured from the center of the tube, then plot the velocity profiles measured for the high and low flow rates (for both 60 and 35 Distance Pitot tube can travel 1+ 2.365inch T atm (C) 19.9 Air Density (lb/in^3) 4.3E-5 0 Inner Diameter (60) 0.103 Equal Areas (all dimensions are in inch) 2.5inch 0.217 P atm (Hg) 30.04 0.346 6th 5th 4th 3rd 2nd 1st Oth Water Density (lb/in^3) 3.6E-2 Table 2. Constant variables atm Flow Rate 60 (in H20) 6.85 6.85 -Inner Diameter of the Tube Pitot-low (in) Pitot-high (in) Pitot fiff (in) 2.3645 0 2.3645 Table 1. Initial settings 6.85 6.85 2.262 2.148 2.019 1.865 1.665 1.183 0.700 0.500 0.346 0.217 0.103 0.000 Gravity (in/s^2) 386.4 Dynamic Pressure 60 (in H20) 0.25 0.33 t wall (in) 0.06775 0.39 0.41 1
Step by Step Solution
There are 3 Steps involved in it
Step: 1

Get Instant Access to Expert-Tailored Solutions
See step-by-step solutions with expert insights and AI powered tools for academic success
Step: 2

Step: 3

Ace Your Homework with AI
Get the answers you need in no time with our AI-driven, step-by-step assistance
Get StartedRecommended Textbook for
Elementary Statistics
Authors: Neil A. Weiss
8th Edition
321691237, 978-0321691231
Students also viewed these Mechanical Engineering questions
Question
Answered: 1 week ago
Question
Answered: 1 week ago
Question
Answered: 1 week ago
Question
Answered: 1 week ago
Question
Answered: 1 week ago
Question
Answered: 1 week ago
Question
Answered: 1 week ago
Question
Answered: 1 week ago
Question
Answered: 1 week ago
Question
Answered: 1 week ago
Question
Answered: 1 week ago
Question
Answered: 1 week ago
Question
Answered: 1 week ago
Question
Answered: 1 week ago
Question
Answered: 1 week ago
Question
Answered: 1 week ago
Question
Answered: 1 week ago
Question
Answered: 1 week ago
Question
Answered: 1 week ago
Question
Answered: 1 week ago
Question
Answered: 1 week ago
Question
Answered: 1 week ago
View Answer in SolutionInn App


