3. Do a ratio analysis for Nike for 2012 and 2013 for the ratios listed in the Nike, Inc., Problem on pages 748-749 of your textbook. You also need to comment on each set of ratios that you calculate.
| 1) | | | | |
| Nike Inc., Consolidated Income Statement | | | |
| USD $ in millions | | | | |
| 12 months ended | May 31, 2013 | May 31, 2012 | Horizontal Analysis | |
| Revenues | 25,313 | 23,331.00 | 8.495% | |
| Cost of sales | -14,279 | - 13,183.00 | 8.314% | |
| Gross profit | 11,034 | 10,148.00 | 8.731% | |
| Demand creation expense | -2,745 | - 2,607.00 | 5.293% | |
| Operating overhead expense | -5,035 | - 4,458.00 | 12.943% | |
| Selling and administrative expense | - 7,780.00 | - 7,065.00 | 10.120% | |
| Interest income (expense), net | 3 | - 4.00 | -175.000% | |
| Other income (expense), net | 15 | - 54.00 | -127.778% | |
| Income before income taxes | 3,272 | 3,025 | 8.165% | |
| Income tax expense | -808 | - 756.00 | 6.878% | |
| Net income from continuing operations | 2,464 | 2,269 | 8.594% | |
| Net income from discontinued operations | 21 | - 46.00 | -145.652% | |
| Net income | 2,485 | 2,223.00 | 11.786% | |
| | | | | |
| 2) | | | | |
| Nike Inc., Consolidated Income Statement | Verticle Analysis | | |
| Revenues | 25,313 | 100.00% | | |
| Cost of sales | -14,279 | -56.41% | | |
| Gross profit | 11,034 | 43.59% | | |
| Demand creation expense | -2,745 | -10.84% | | |
| Operating overhead expense | -5,035 | -19.89% | | |
| Selling and administrative expense | - 7,780.00 | -30.74% | | |
| Interest income (expense), net | 3 | 0.01% |
| Other income (expense), net | 15 | 0.06% | | |
| Income before income taxes | 3,272 | 12.93% |
| Income tax expense | -808 | -3.19% | | |
| Net income from continuing operations | 2,464 | 9.73% | | |
| Net income from discontinued operations | 21 | 0.08% |
| Net income | 2,485 | 9.82% |
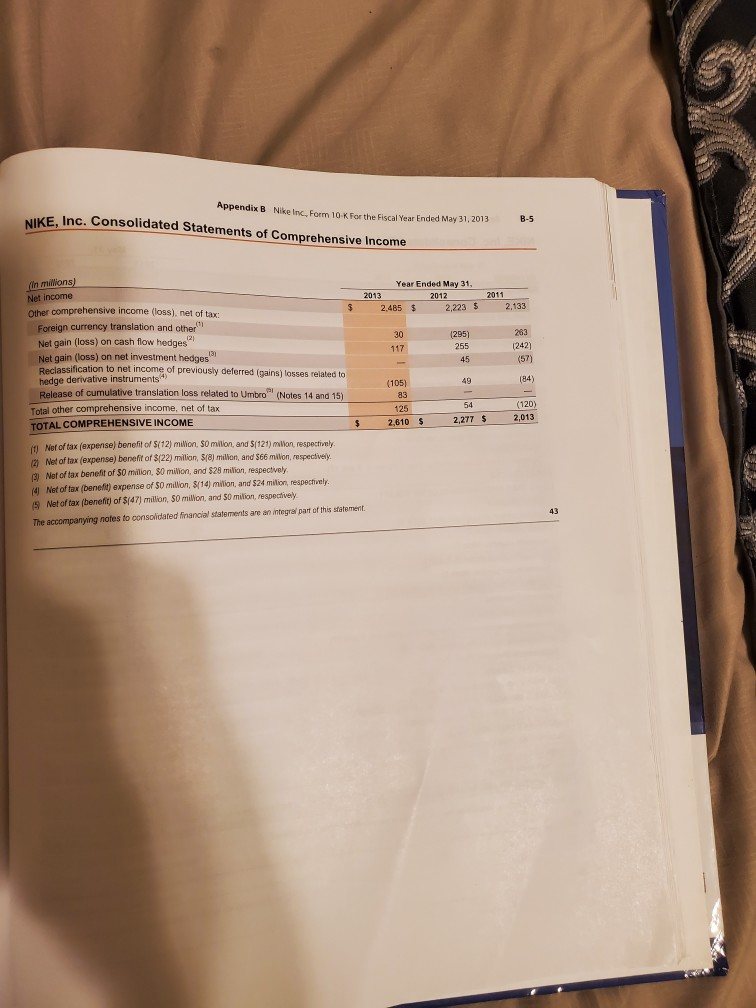
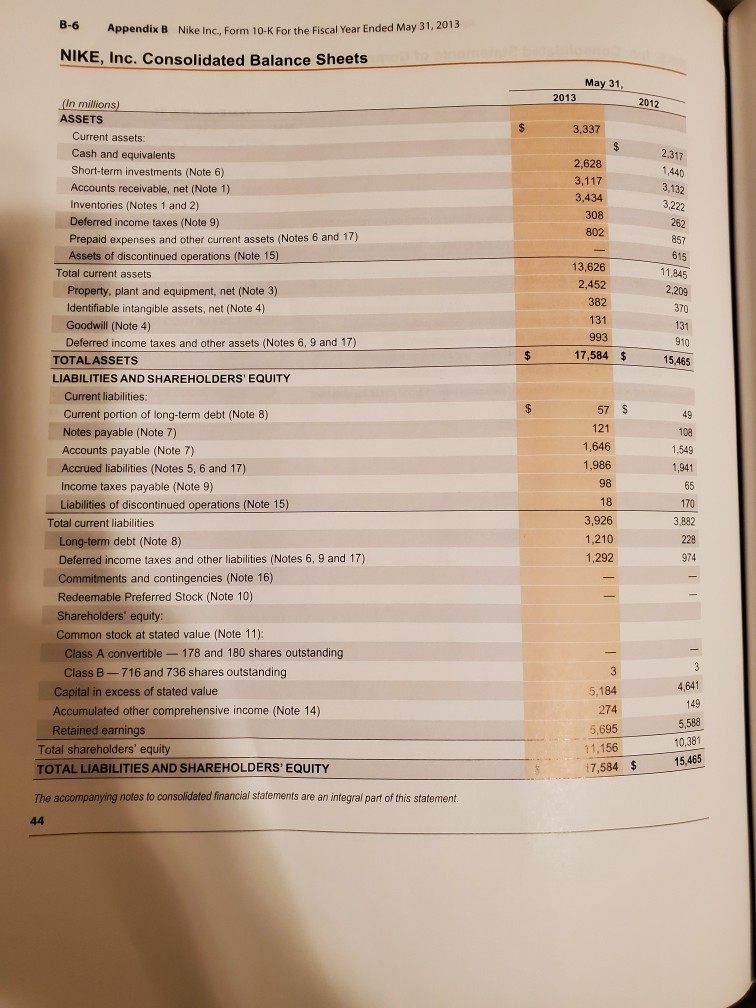
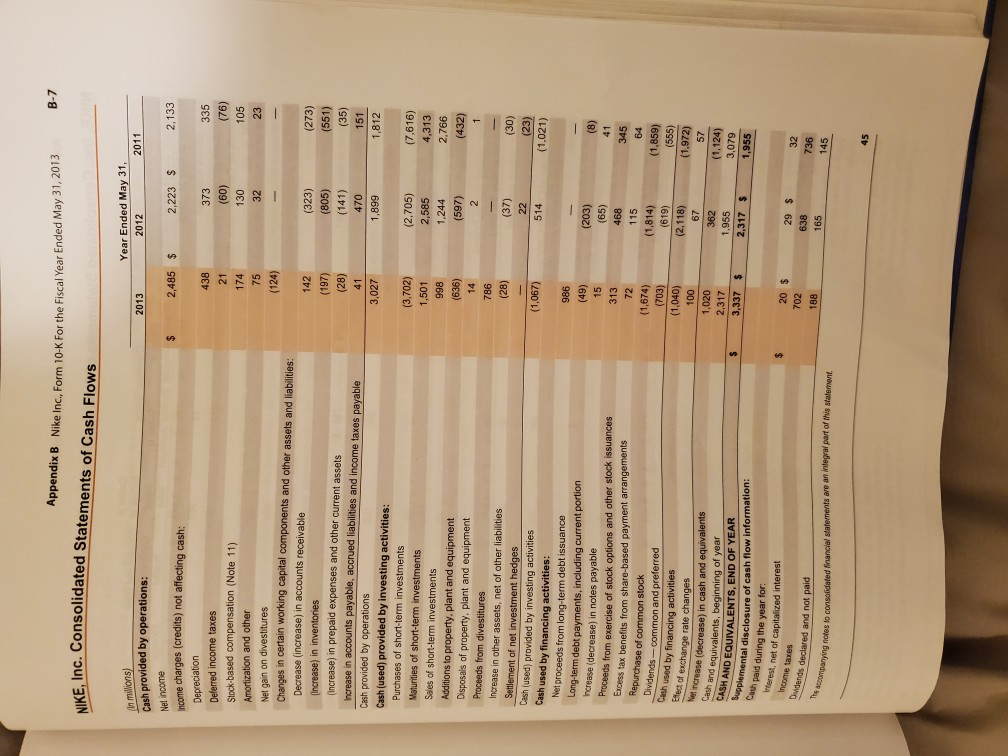
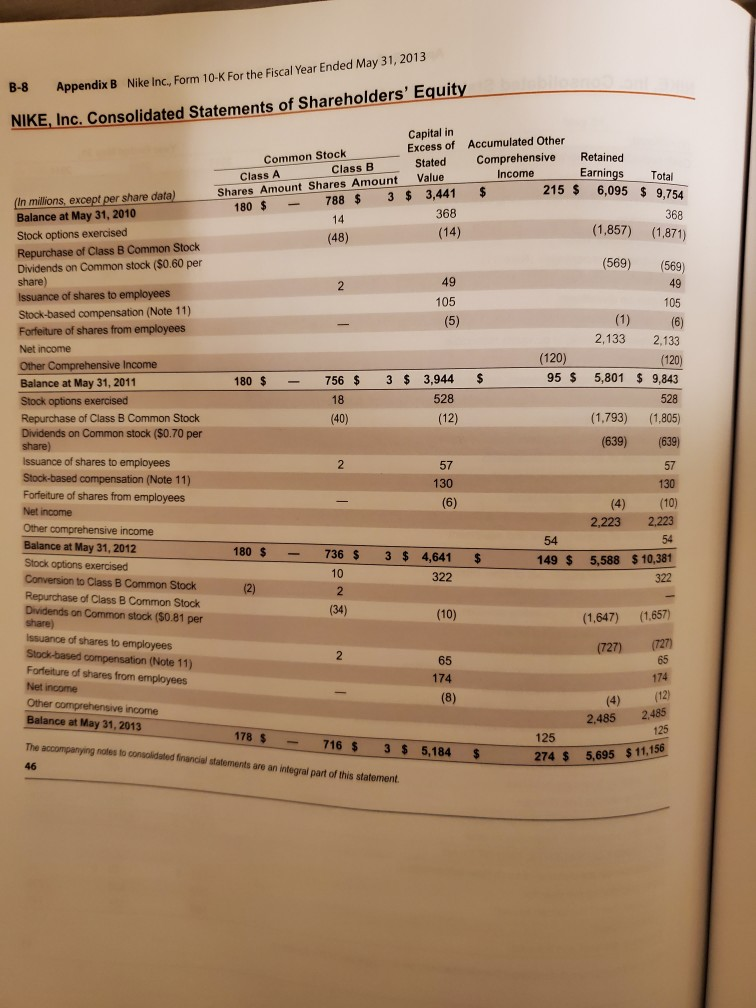
Appendix B Nike Inc. Form 10-K For the Fiscal Year Ended May 31, 2013 NIKE, Inc. Consolidated Statements of Comprehensive Income B-5 (n millons) Net income Other comprehensive income (loss), net of tax: Year Ended May 31, 2011 2013 2012 2,223 $ 2,133 2,485 $ Foreign currency translation and other Net gain (loss) on cash flow hedges Net gain (loss) on net investment hedges Reclassification to net income of previously deferred (gains) losses related to hedge derivative instruments4 Release of cumulative translation loss related to Umbro (Notes 14 and 15) 263 30 (295) (2) (242) 255 117 131 (57) 45 (84) 49 (105) 83 (120) 54 Total other comprehensive income, net of tax 125 2,013 2,277 2,610 $ TOTAL COMPREHENSIVE INCOME $ Net of tax (expense) benefit of S(12) milion, S0 milon, and S(121) milion, respectively m Net of tax (expense) benefit of $(22) million, $(8) milion, and $66 milon, respectively 3) Net of tax benefit of $0 million, 80 milion, and $28 milian, respectively (4) Net of tax (benefit) expense of $0 millon, $(14) milion, and $24 milion, respectively. S Net of tax (benefit) of $(47) million, S0 million, and 50 milion, respectively 43 The accompanying notes to consoidated financial statements are an integral part of this statement. -6 Appendix B Nike Inc., Form 10-K For the Fiscal Year Ended May 31, 2013 NIKE, Inc. Consolidated Balance Sheets May 31, 2013 2012 (In millions) ASSETS $ 3,337 Current assets: $ 2,317 Cash and equivalents 2,628 Short-term investments (Note 6) 1,440 3,117 3,132 Accounts receivable, net (Note 1) 3,434 Inventories (Notes 1 and 2) 3,222 308 Deferred income taxes (Note 9) 262 802 Prepaid expenses and other current assets (Notes 6 and 17) Assets of discontinued operations (Note 15) 857 615 13,626 11,845 Total current assets 2,452 2,209 Property, plant and equipment, net (Note 3) Identifiable intangible assets, net (Note 4) Goodwill (Note 4) 382 370 131 131 910 993 Deferred income taxes and other assets (Notes 6, 9 and 17) $ 17,584 $ TOTALASSETS 15,465 LIABILITIES AND SHAREHOLDERS' EQUITY Current liabilities: $ 57 $ Current portion of long-term debt (Note 8) Notes payable (Note 7) Accounts payable (Note 7) 49 121 108 1,646 1,549 1,986 Accrued liabilities (Notes 5, 6 and 17) 1,941 98 Income taxes payable (Note 9) 65 Liabilities of discontinued operations (Note 15) 18 170 3,926 3,882 Total current liabilities 1,210 Long-term debt (Note 8) 228 1,292 974 Deferred income taxes and other liabilities (Notes 6, 9 and 17) Commitments and contingencies (Note 16) Redeemable Preferred Stock (Note 10) Shareholders' equity: Common stock at stated value (Note 11): Class A convertible- 178 and 180 shares outstanding Class B-716 and 736 shares outstanding 3 3 4,641 Capital in excess of stated value Accumulated other comprehensive income (Note 14) 5,184 149 274 5588 5,695 Retained earnings 10,381 15,465 Total shareholders' equity 11,156 17,584 $ TOTAL LIABILITIES AND SHAREHOLDERS' EQUITY The accompanying notes to consoliadated financial statements are an integral part of this statement. 44 B-7 Appendix B Nike Inc., Form 10-K For the Fiscal Year Ended May 31, 2013 NIKE, Inc. Consolidated Statements of Cash Flows Year Ended May 31, n millions) Cash provided by operations: 2011 2013 2012 Net income 2,485 $ 2,223 S 2,133 $ Income charges (Credits) not affecting cash: Depreciation 438 373 335 Deferred income taxes 21 (76) (09) Stock-based compensation (Note 11) 174 105 Amortization and other 75 32 23 Net gain on divestitures Changes in certain working capital components and other assets and liabilities: Decrease (increase) in accounts receivable 142 (323) (273) (Increase) (Increase) in prepaid expenses and other current assets Increase in accounts payable, accrued liabilities and income taxes payable inventories (805) (551) (141) (35) (8z) 41 470 151 edo a pepiNod use Cash (used) provided by investing activities: operations 3,027 1,812 668' Purchases of short-term investments (3,702) (2,705) (7,616) Maturities of short-term investments 1,501 2,585 4,313 camunes Sales of short-term investments 1,244 2,766 866 Additions to property, plant and equipment Disposals of property, plant and equipment (99) 14 (269) 2 (432) Proceeds from divestitures 786 Increase in other assets, net of other liabilities Settlement (28) (37) (oc) (23) net investment hedges 22 (1,067) 514 (1,021) Cash used by financing activities Net proceeds term debt issuance Long-lerm debt payens, ncluding current portion senIAR 6unsaAn ig pepaaud (pasn) u from I 986 (6t) 15 (203) (8) 41 ncrease (decrease) in notes payable (s9) 468 Proceeds from exercise of stock options and other stock issuances Excess tax benefits from share-based payment arrangements Repurchase of common stock 313 345 72 115 64 (1,674) Dividends-common and preferred Cash used by financing activities ect of exchange rate changes eL8') (619) (1,859) (555) (1,972) (e0L) (1,040) (2,118) Net increase (decrease) in cash and equivalents 001 1,020 362 (1,124) ash and equivalents, beginning of year CASH AND EQUIVALENTS, END OF YEAR 2,317 1,955 640 1,955 $ 3,337 2,317 $ Supplemental disclosure of cash flow information: Cash paid during the year for: erest, net of capitalized interest Income taxes 20 $ S 6 736 32 702 ividends declared and not paid 188 165 145 acompanying fiotes to consolidated financial statements are an integral part of this statement Nike Inc, Form 10-K For the Fiscal Year Ended May 31, 2013 B-8 CIKE, Inc. Consolidated Statements of Shareholders' Equity Capital in Excess of Stated Value Appendix B Accumulated Other Comprehensive Common Stock Class B Retained Earnings 6,095 9,754 Total Income Class A Shares Amount Shares Amount 180 $ 215 $ $ (In millions, except per share data) Balance at May 31, 2010 Stock options exercised Repurchase of Class B Common Stock Dividends on Common stock ($0.60 per share) Issuance of shares to employees Stock-based compensation (Note 11) 3 3,441 788 $ 368 368 14 (1,857) (1,871) (14) (48) (569) (569) 49 49 2 105 105 (1) (5) (6) Forfeiture of shares from employees 2,133 2,133 Net income (120) (120) Other Comprehensive Income 95 $ 5,801 9,843 3 3,944 $ 756 $ 180 $ Balance at May 31, 2011 528 528 Stock options exercised Repurchase of Class B Common Stock Dividends on Common stock ($0.70 per share) Issuance of shares to employees Stock-based compensation (Note 11) Forfeiture of shares from employees Net income 18 (12) (1,793) (1,805) (40) (639) (639) 2 57 57 130 130 (6) (10) (4) 2,223 2,223 Other comprehensive income 54 54 Balance at May 31, 2012 180 $ 3 4,641 736 $ $ 149 $ 5,588 $10,381 Stock options exercised Conversion to Class B Common Stock 10 322 322 (2) 2 Repurchase of Class B Common Stock Dividends on Common stock ($0.81 per share) Issuance of shares to employees (34) (10) (1,657) (1,647) (727) 65 (727) Stock-based compensation (Note 11) 65 Forfeiture of shares from employees Net income 174 174 (12) (8) (4) Other comprehensive income 2.485 2,485 Balance at May 31, 2013 125 178 $ 125 The accompanying notes to consolidated financial statements are an integral part of this statement. 716 S 3 $ 5,184 5,695 $11,156 274 $ 46 1. Prepare four line graphs with the ratio on the vertical axis and the years on the hor Instructions zontal axis for the following four ratios (rounded to one decimal place): a. Rate earned on total assets b. Rate earned on stockholders' equity c. Number of times interest charges are earned d. Ratio of liabilities stockholders' equity Display both the company ratio and the industry benchmark on each graph. That is, each graph should have two lines. 2. Prepare an analysis of the graphs in (1) Nike, Inc., Problem Financial Statement Analysis The financial statements for Nike, Inc., are presented in Appendix B at the end of the text. The following additional information (in thousands) is available Accounts receivable at May 31, 2010 Inventories at May 31, 2010 Total assets at May 31, 2010 Stockholders' equity at May 31, 2010 3,138 2,715 14,998 9,843 Instructions 1. Determine the following measures for the fiscal years ended May 31, 2013 (fiscal 2012) and May 31, 2012 (fiscal 2011), rounding to one decimal place. a. Working capital b. Current ratio c. Quick ratio d. Accounts receivable turnover Chapter 15 749 Financial Statement Analysis e. Number of days' sales in receivables f. Inventory turnover . Number of days' sales in inventory J. 2,3 h. Ratio of liabilities to stockholders' equity i. Ratio of sales to assets 012 D0,000 D0,000 20,000 2,000 Rate earned on total assets, assuming interest expense is $23 million for the year ending May 31, 2013, and $31 million for the year ending May 31, 2012 k. Rate earned on common stockholders' equity 1. Price-carnings ratio, assuming that the market price was $61.66 per share on May 31, 2013, and $53.10 per share on May 31, 2012 0,000 5,000 0,000 m. Percentage relationship of net income to sales What conclusions can be drawn from these analyses? 2. the Cases&Projects for CP 15-1 Analysis of financing corporate growth Assume that the president of Freeman Industries Inc. made the following statement in the Annual Report to Shareholders: The founding family and majority shareholders of the company do not believe in using debt to finance future growth. The founding family learned from hard experience during Prohibition and thee Great Depression that debt can cause loss of flexibility and eventual loss of corporate control. The company will not place itself at such risk. As such, all future growth will be financed either by stock sales to the public or by internally generated resources." ri- As a public shareholder of this company, how would you respond to this policy? Rodgers Industries Inc. omplete scal year on December 31. The auditor, Josh McCoy, has approached he :F, Ae Aferh cardo the yoarend receivables and e inventory tornover Receivables an CP 15-2 oevealfe kes place: stle oS kadetermine if there have process Thsy batet inventory levels of Rodgers Josh: We are beginning our audit of R-decis ltiles atelent been significant changes in operations or finncol post Indicates that the inventory turnover has decre sed fom 5.11 decreased from 11 to 7. Could you explain this change in opeat C ble wem Aaron: There is little need for concern. The inverntory represents com holiday buying season. We are confident, however, that we wilf be able t next fiscal year. Josh: What gives you this confidence? Aaron: We will Increase our advertising and provide some very attractive price co tom We have no choice. Newer technology is already out there, and we have to unload th vertony thero Aaron: As you may be aware, the company is under tremendous pressure to expand sales and profits As e lowered our credit standards to our commercial customers so that we would be able to sell products tos onder customer base, As a result of this policy change, we have been able to expand sales by 35% Josh:... and the receivables? JOSH: Your responses have not been reassuring to me. Agron: I'm a little confused. Assets are good, right? Why don't you look at our current ratio? It has improved, hasn't it? Liuthat yery favorably. burno1