Answered step by step
Verified Expert Solution
Question
1 Approved Answer
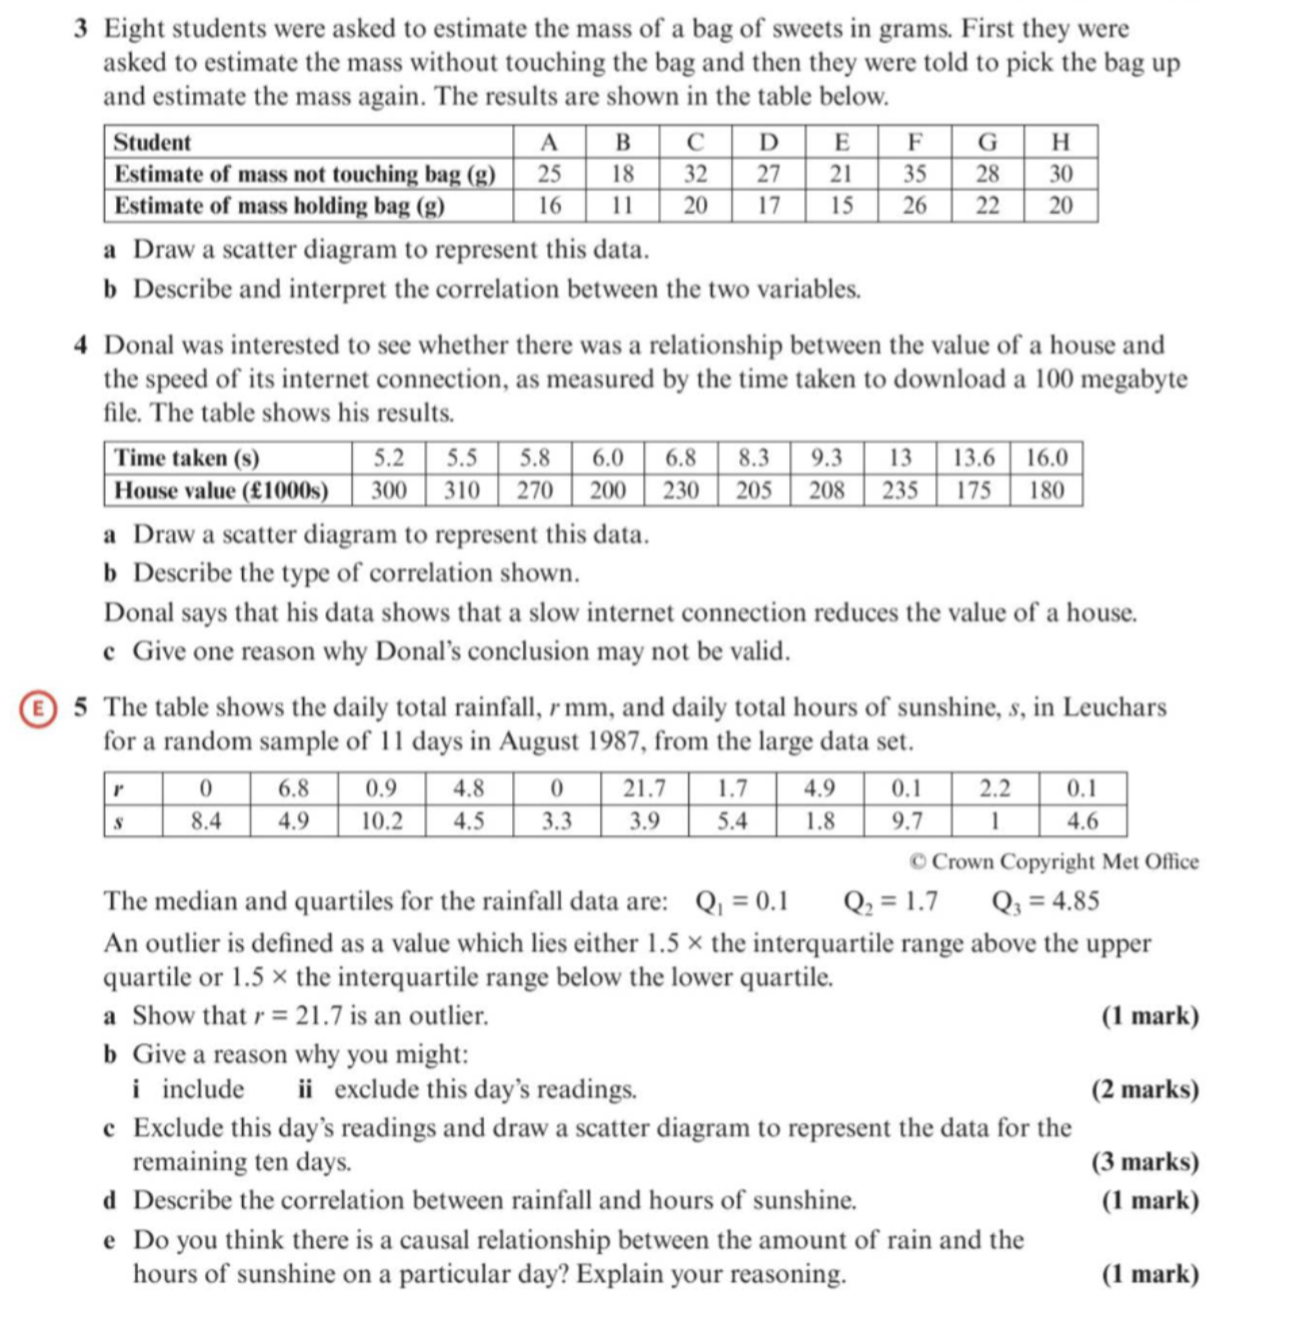
3 Eight students were asked to estimate the mass of a bag of sweets in grams. First they were asked to estimate the mass

3 Eight students were asked to estimate the mass of a bag of sweets in grams. First they were asked to estimate the mass without touching the bag and then they were told to pick the bag up and estimate the mass again. The results are shown in the table below. Student A B C D E Estimate of mass not touching bag (g) 25 18 32 27 21 Estimate of mass holding bag (g) 16 11 20 17 15 F385 G 28 H 30 26 22 20 a Draw a scatter diagram to represent this data. b Describe and interpret the correlation between the two variables. 4 Donal was interested to see whether there was a relationship between the value of a house and the speed of its internet connection, as measured by the time taken to download a 100 megabyte file. The table shows his results. Time taken (s) House value (1000s) 5.2 5.5 5.8 6.0 6.8 8.3 9.3 13 13.6 16.0 300 310 270 200 230 205 208 235 175 180 a Draw a scatter diagram to represent this data. b Describe the type of correlation shown. Donal says that his data shows that a slow internet connection reduces the value of a house. e Give one reason why Donal's conclusion may not be valid. 5 The table shows the daily total rainfall, rmm, and daily total hours of sunshine, s, in Leuchars for a random sample of 11 days in August 1987, from the large data set. r 0 6.8 0.9 4.8 0 21.7 1.7 4.9 0.1 2.2 0.1 S 8.4 4.9 10.2 4.5 3.3 3.9 5.4 1.8 9.7 1 4.6 Crown Copyright Met Office The median and quartiles for the rainfall data are: Q = 0.1 Q2=1.7 Q = 4.85 An outlier is defined as a value which lies either 1.5 the interquartile range above the upper quartile or 1.5x the interquartile range below the lower quartile. a Show that r=21.7 is an outlier. (1 mark) b Give a reason why you might: i include ii exclude this day's readings. (2 marks) e Exclude this day's readings and draw a scatter diagram to represent the data for the remaining ten days. (3 marks) d Describe the correlation between rainfall and hours of sunshine. (1 mark) e Do you think there is a causal relationship between the amount of rain and the hours of sunshine on a particular day? Explain your reasoning. (1 mark)
Step by Step Solution
There are 3 Steps involved in it
Step: 1

Get Instant Access to Expert-Tailored Solutions
See step-by-step solutions with expert insights and AI powered tools for academic success
Step: 2

Step: 3

Ace Your Homework with AI
Get the answers you need in no time with our AI-driven, step-by-step assistance
Get Started


