Question
3. Estimate a risk adjusted cost of capital for the two business units and comment on whether Meyers graph is accurate (case Figure 1). In
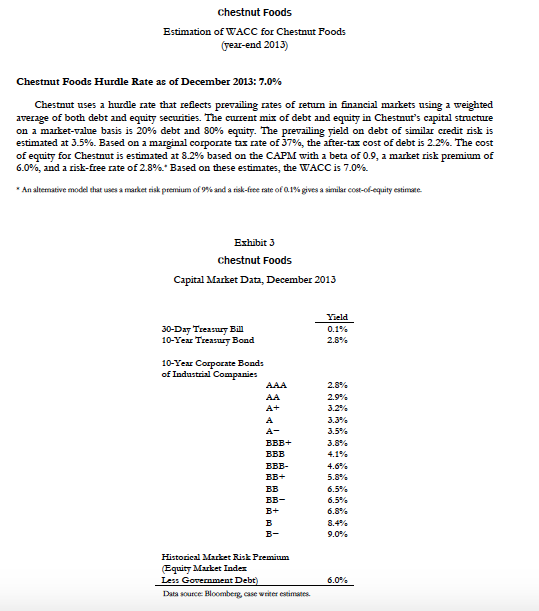
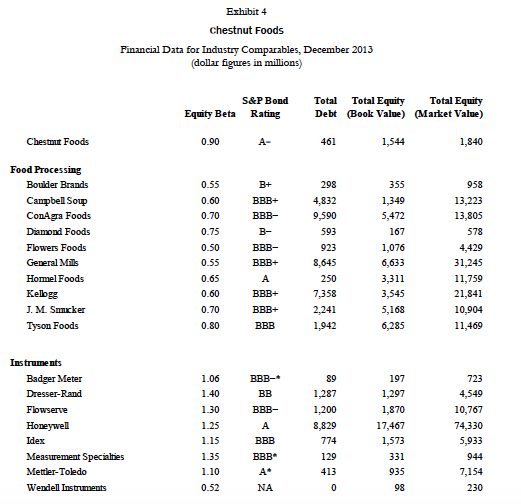
3. Estimate a risk adjusted cost of capital for the two business units and comment on whether Meyers graph is accurate (case Figure 1). In estimating the cost of capital, consider the WACC estimates based on the comparable companies.
4. Calculate the EVA of Chestnuts divisions using a constant WACC and the divisional risk-adjusted WACC. How does the choice of a constant versus risk-adjusted hurdle rate affect the EVAof Chestnuts two divisions?


Recently the companys return on capital has been 6.7%. Company managment applied a hurdle rate of 7.0% to all capital projects and to the evaluation of business units.
The two business units i belive to be the food processing and instruement parts of the company.
chestnut Foods Estimation of WACC for Chestnut Foods (rear-end 2013) Chestnut Foods Hurdle Rate as of December 2013: 7.0% Chestnut uses a hurdle rate that reflects prevailing rates of returm in financial markets using a weighterd average of both debt and equity securities. The current mix of debt and equity in Chestaut's capital structure on a market-value basis is 20% debt and 80% equity. The prevailing yield on debt of similar credit risk is estimated at 3.5%. Based on a marginal corporate tax rate of 37%, the after-tax cost of debt is 2.2%. The cost of equity for Chestnut is estimated at 8.2% based on the CAPM with a beta of 0.9, a market risk prem mm of 6.0%, an d a risk-free rate of 2.8%. Based on these estimates, the WACC is 7.0%. d ebt and equity in Chestaur s .,An alternative model that uses a market tisk prensum of 9% and a tsk-free tate of a 1% gives sentlar cost-ofequity estimate. Exhibit 3 chestnut Foods Capital Market Data, December 2013 Yield 0.1% 30-Day Treaury Bill l0-Yeai Trea Boad 10-Year Corporate Bond: 2.8% 2.9% 3.2% 3.3% 3.5% 3.8% 4,1% 4.6% 5.8% 6.5% 6.5% 6.8% 8.4% 9.0% A+ Historical Market Rick Premium Equity Market Indes Less Government Deb 6.0 Data sounce Blocenberg, ease writer esimaees. chestnut Foods Estimation of WACC for Chestnut Foods (rear-end 2013) Chestnut Foods Hurdle Rate as of December 2013: 7.0% Chestnut uses a hurdle rate that reflects prevailing rates of returm in financial markets using a weighterd average of both debt and equity securities. The current mix of debt and equity in Chestaut's capital structure on a market-value basis is 20% debt and 80% equity. The prevailing yield on debt of similar credit risk is estimated at 3.5%. Based on a marginal corporate tax rate of 37%, the after-tax cost of debt is 2.2%. The cost of equity for Chestnut is estimated at 8.2% based on the CAPM with a beta of 0.9, a market risk prem mm of 6.0%, an d a risk-free rate of 2.8%. Based on these estimates, the WACC is 7.0%. d ebt and equity in Chestaur s .,An alternative model that uses a market tisk prensum of 9% and a tsk-free tate of a 1% gives sentlar cost-ofequity estimate. Exhibit 3 chestnut Foods Capital Market Data, December 2013 Yield 0.1% 30-Day Treaury Bill l0-Yeai Trea Boad 10-Year Corporate Bond: 2.8% 2.9% 3.2% 3.3% 3.5% 3.8% 4,1% 4.6% 5.8% 6.5% 6.5% 6.8% 8.4% 9.0% A+ Historical Market Rick Premium Equity Market Indes Less Government Deb 6.0 Data sounce Blocenberg, ease writer esimaeesStep by Step Solution
There are 3 Steps involved in it
Step: 1

Get Instant Access to Expert-Tailored Solutions
See step-by-step solutions with expert insights and AI powered tools for academic success
Step: 2

Step: 3

Ace Your Homework with AI
Get the answers you need in no time with our AI-driven, step-by-step assistance
Get Started


