Answered step by step
Verified Expert Solution
Link Copied!

Question

1 Approved Answer

3. Find the area under the standard normal distribution curve of following: a. Between z = 0 and z= -0.32 b. To the right of
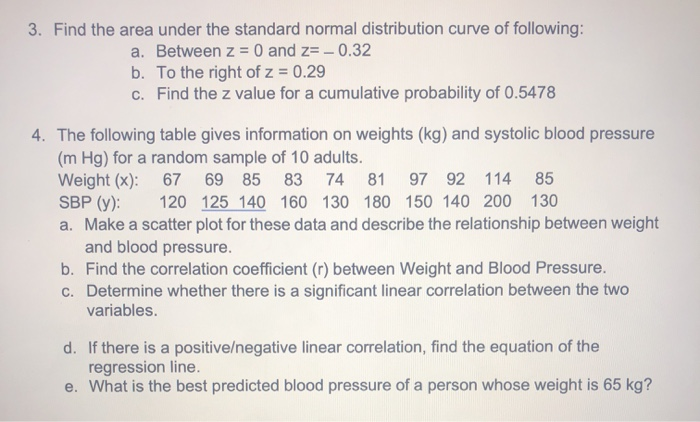
image text in transcribed
3. Find the area under the standard normal distribution curve of following: a. Between z = 0 and z= -0.32 b. To the right of z = 0.29 C. Find the z value for a cumulative probability of 0.5478 4. The following table gives information on weights (kg) and systolic blood pressure (m Hg) for a random sample of 10 adults. Weight (x): 67 69 85 83 74 81 97 92 114 85 SBP (y): 120 125 140 160 130 180 150 140 200 130 a. Make a scatter plot for these data and describe the relationship between weight and blood pressure. b. Find the correlation coefficient (r) between Weight and Blood Pressure. c. Determine whether there is a significant linear correlation between the two variables. d. If there is a positiveegative linear correlation, find the equation of the regression line e. What is the best predicted blood pressure of a person whose weight is 65 kg

Step by Step Solution

There are 3 Steps involved in it

Step: 1

blur-text-image

Get Instant Access to Expert-Tailored Solutions

See step-by-step solutions with expert insights and AI powered tools for academic success

Step: 2

blur-text-image_2

Step: 3

blur-text-image_3

Ace Your Homework with AI

Get the answers you need in no time with our AI-driven, step-by-step assistance

Get Started

Recommended Textbook for

Workbook/Study Guide To Accompany Managerial Accounting

Authors: Ray H Garrison, Eric Noreen, Peter C. Brewer

11th Edition

0072986131, 978-0072986136

More Books

Students also viewed these Accounting questions

Question

What are the determinants of cash cycle ? Explain

Answered: 1 week ago