

Question
3. Find the following values using your data from chart 1 on the first project. Chart 4 Lowest value First Quartile (Q1) Median (Q2) Third
3. Find the following values using your data from chart 1 on the first project.
Chart 4
Lowest value | |
First Quartile (Q1) | |
Median (Q2) | |
Third Quartile (Q3) | |
Highest value | |
Interquartile range |
Total Births | 4 | 3 | 3 | 2 | 7 | 3 | 3 | 4 | 3 | 5 |
4. Create a box and whisker plot using the answers from question 3. Be sure to include the number line and label it.
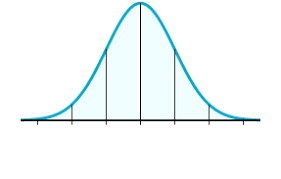
5. Label Graph 1. Using the mean and standard deviation from Chart 3, label the mean. Then label up to 3 standard deviations above and below the mean.

Step by Step Solution
There are 3 Steps involved in it
Step: 1

Get Instant Access to Expert-Tailored Solutions
See step-by-step solutions with expert insights and AI powered tools for academic success
Step: 2

Step: 3
Ace Your Homework with AI
Get the answers you need in no time with our AI-driven, step-by-step assistance
Get Started
College Algebra
Authors: Michael Sullivan
9th Edition
0321830725, 9780321830722