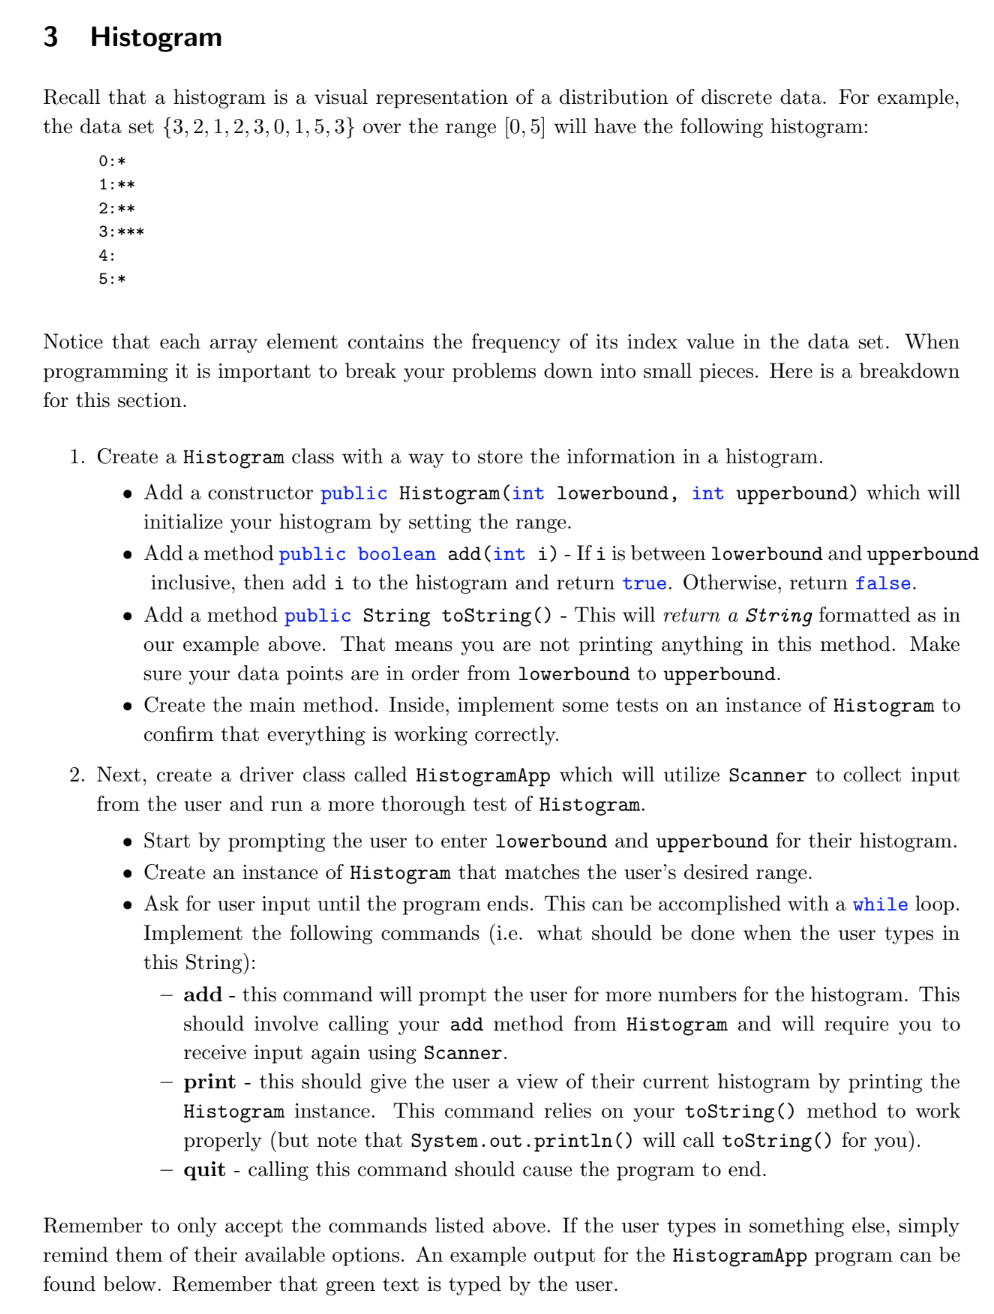
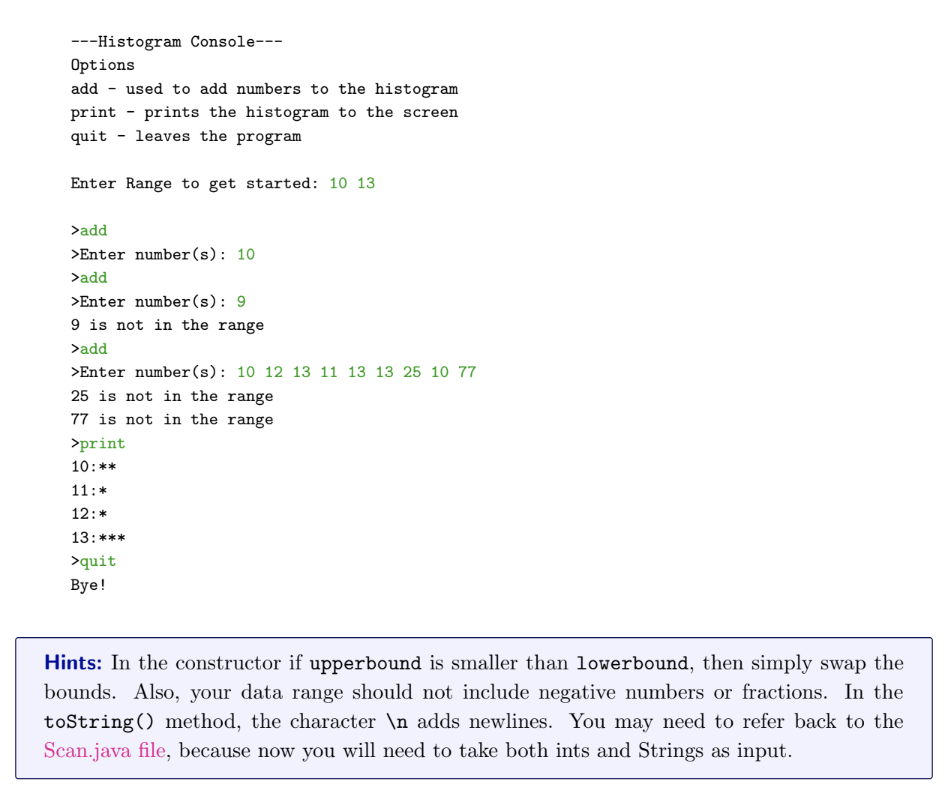
3 Histogram Recall that a histogram is a visual representation of a distribution of discrete data. For example, the data set {3, 2, 1,2,3,0,1,5,3} over the range (0,5) will have the following histogram: 0:* 1:** 2:** 3:*** Notice that each array element contains the frequency of its index value in the data set. When programming it is important to break your problems down into small pieces. Here is a breakdown for this section. 1. Create a Histogram class with a way to store the information in a histogram. Add a constructor public Histogram(int lowerbound, int upperbound) which will initialize your histogram by setting the range. Add a method public boolean add (int i) - If i is between lowerbound and upperbound inclusive, then add i to the histogram and return true. Otherwise, return false. Add a method public String toString() - This will return a String formatted as in our example above. That means you are not printing anything in this method. Make sure your data points are in order from lowerbound to upperbound. Create the main method. Inside, implement some tests on an instance of Histogram to confirm that everything is working correctly. 2. Next, create a driver class called HistogramApp which will utilize Scanner to collect input from the user and run a more thorough test of Histogram. Start by prompting the user to enter lowerbound and upperbound for their histogram. Create an instance of Histogram that matches the user's desired range. Ask for user input until the program ends. This can be accomplished with a while loop. Implement the following commands (i.e. what should be done when the user types in this String): - add - this command will prompt the user for more numbers for the histogram. This should involve calling your add method from Histogram and will require you to receive input again using Scanner. print - this should give the user a view of their current histogram by printing the Histogram instance. This command relies on your toString() method to work properly (but note that System.out.println() will call toString() for you). quit - calling this command should cause the program to end. Remember to only accept the commands listed above. If the user types in something else, simply remind them of their available options. An example output for the HistogramApp program can be found below. Remember that green text is typed by the user. ---Histogram Console--- Options add - used to add numbers to the histogram print - prints the histogram to the screen quit - leaves the program Enter Range to get started: 10 13 >add >Enter number(s): 10 >add >Enter number(s): 9 9 is not in the range >add >Enter number(s): 10 12 13 11 13 13 25 10 77 25 is not in the range 77 is not in the range >print 10:** 11:* 12: * 13:*** >quit Bye! Hints: In the constructor if upperbound is smaller than lowerbound, then simply swap the bounds. Also, your data range should not include negative numbers or fractions. In the toString() method, the character adds newlines. You may need to refer back to the Scan.java file, because now you will need to take both ints and Strings as input