

Question
3. How has JCP managed its working capital accounts over the past eight quarters? Is there an opportunity to squeeze more cash from any of
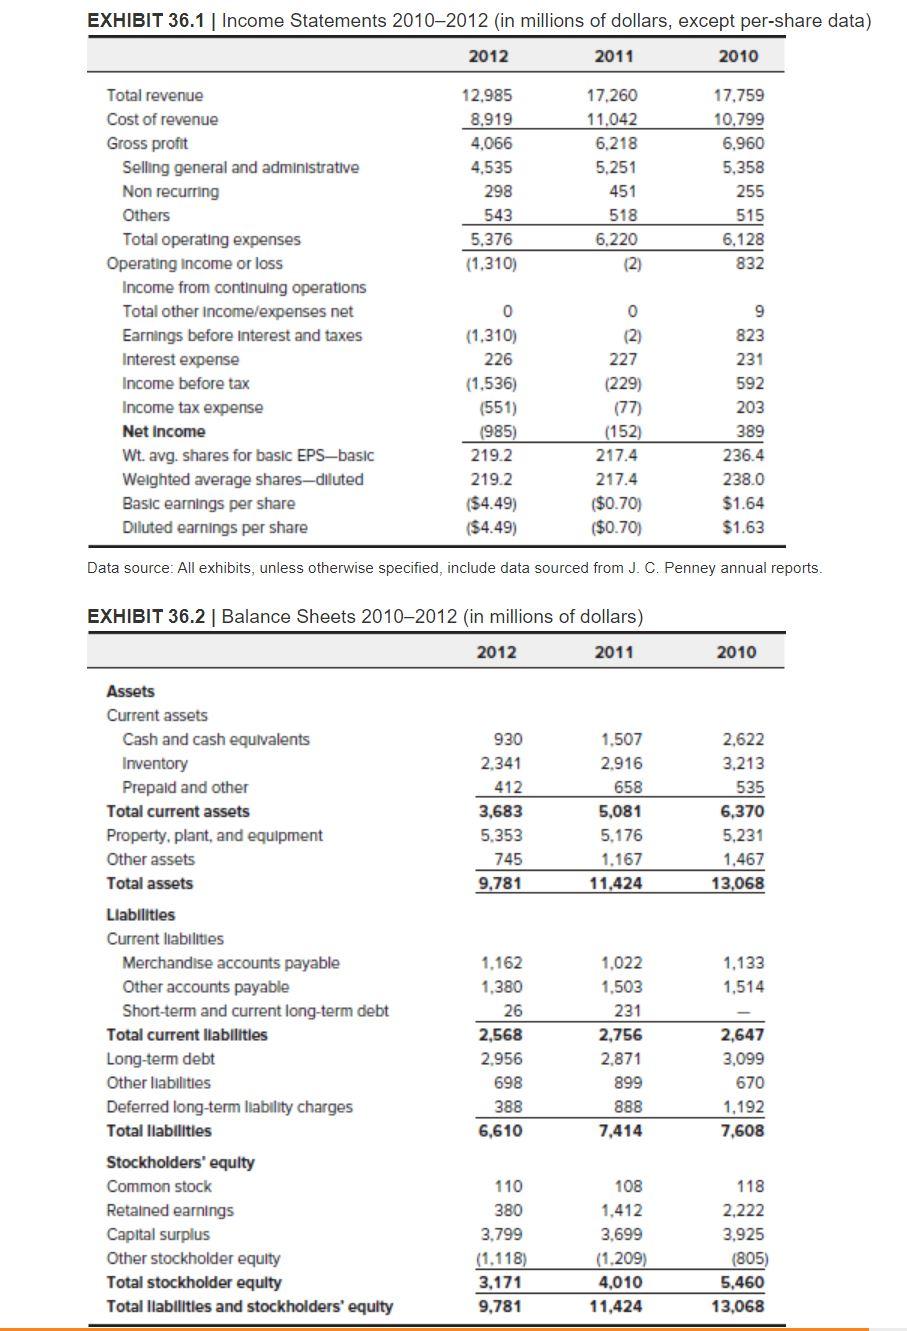
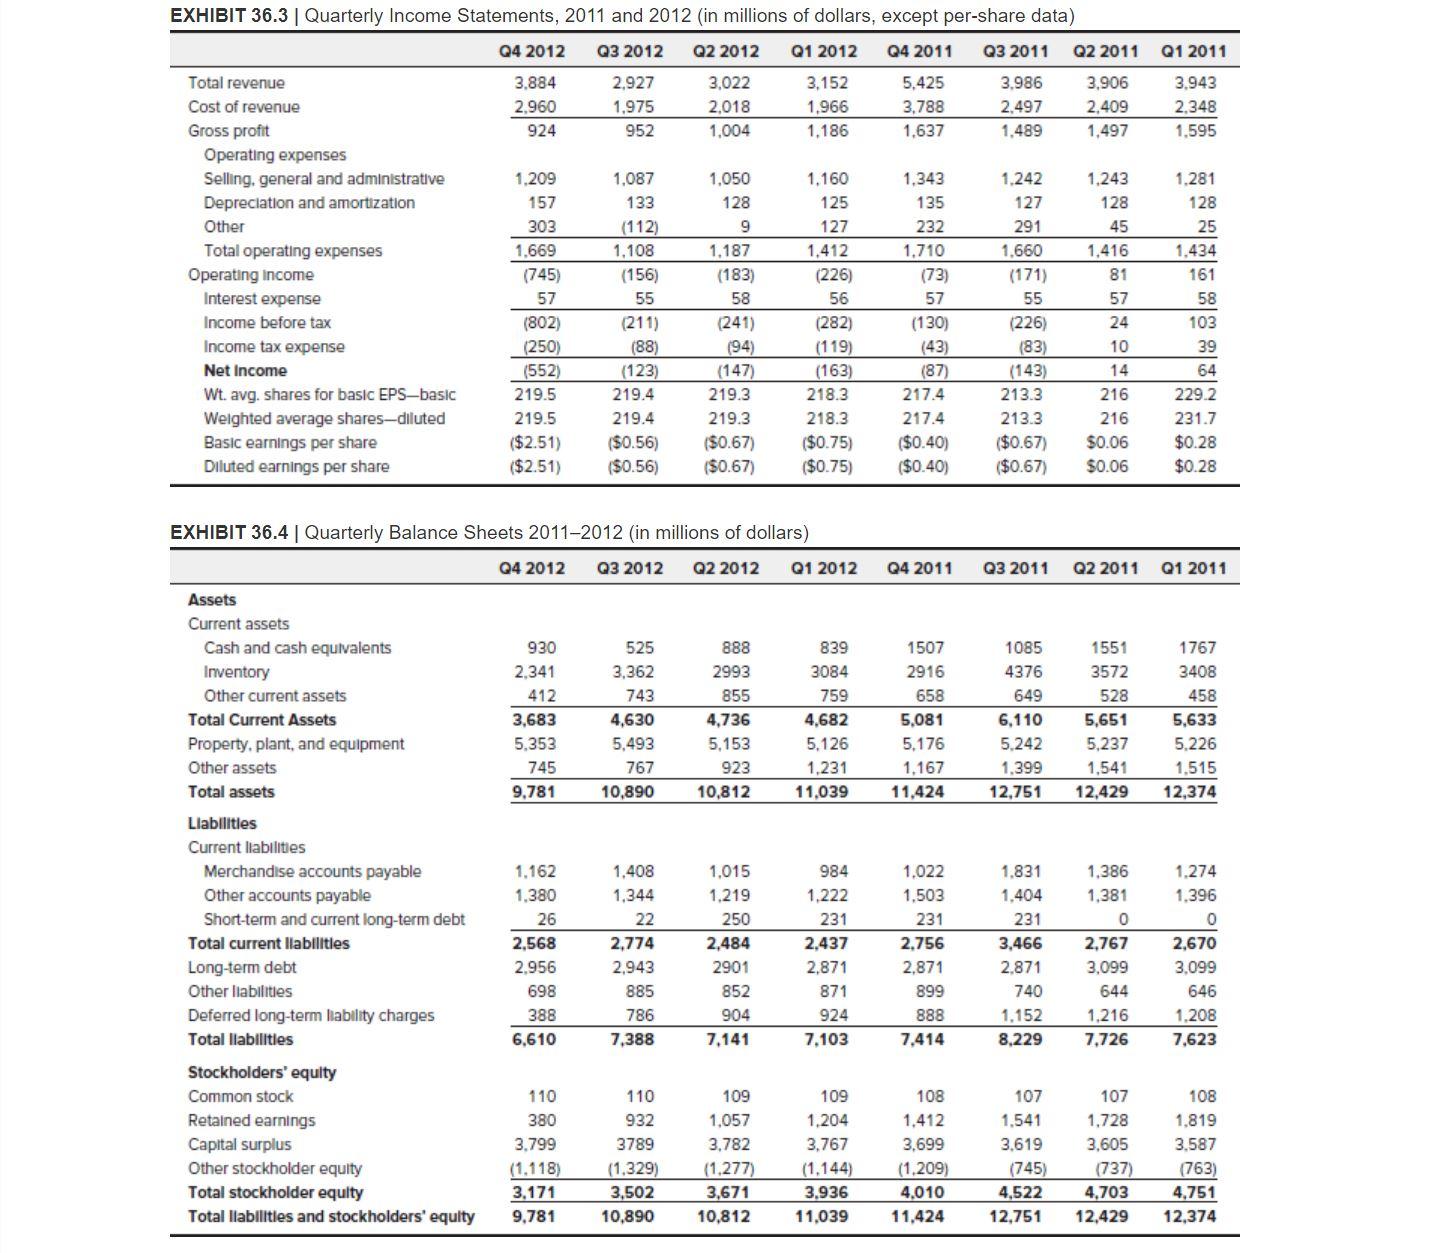
3. How has JCP managed its working capital accounts over the past eight quarters? Is there an opportunity to squeeze more cash from any of these accounts?
(I am posting as a few friends of mine are wondering the answer to the case. Let me know what you think based off of the statements, thank you!!)
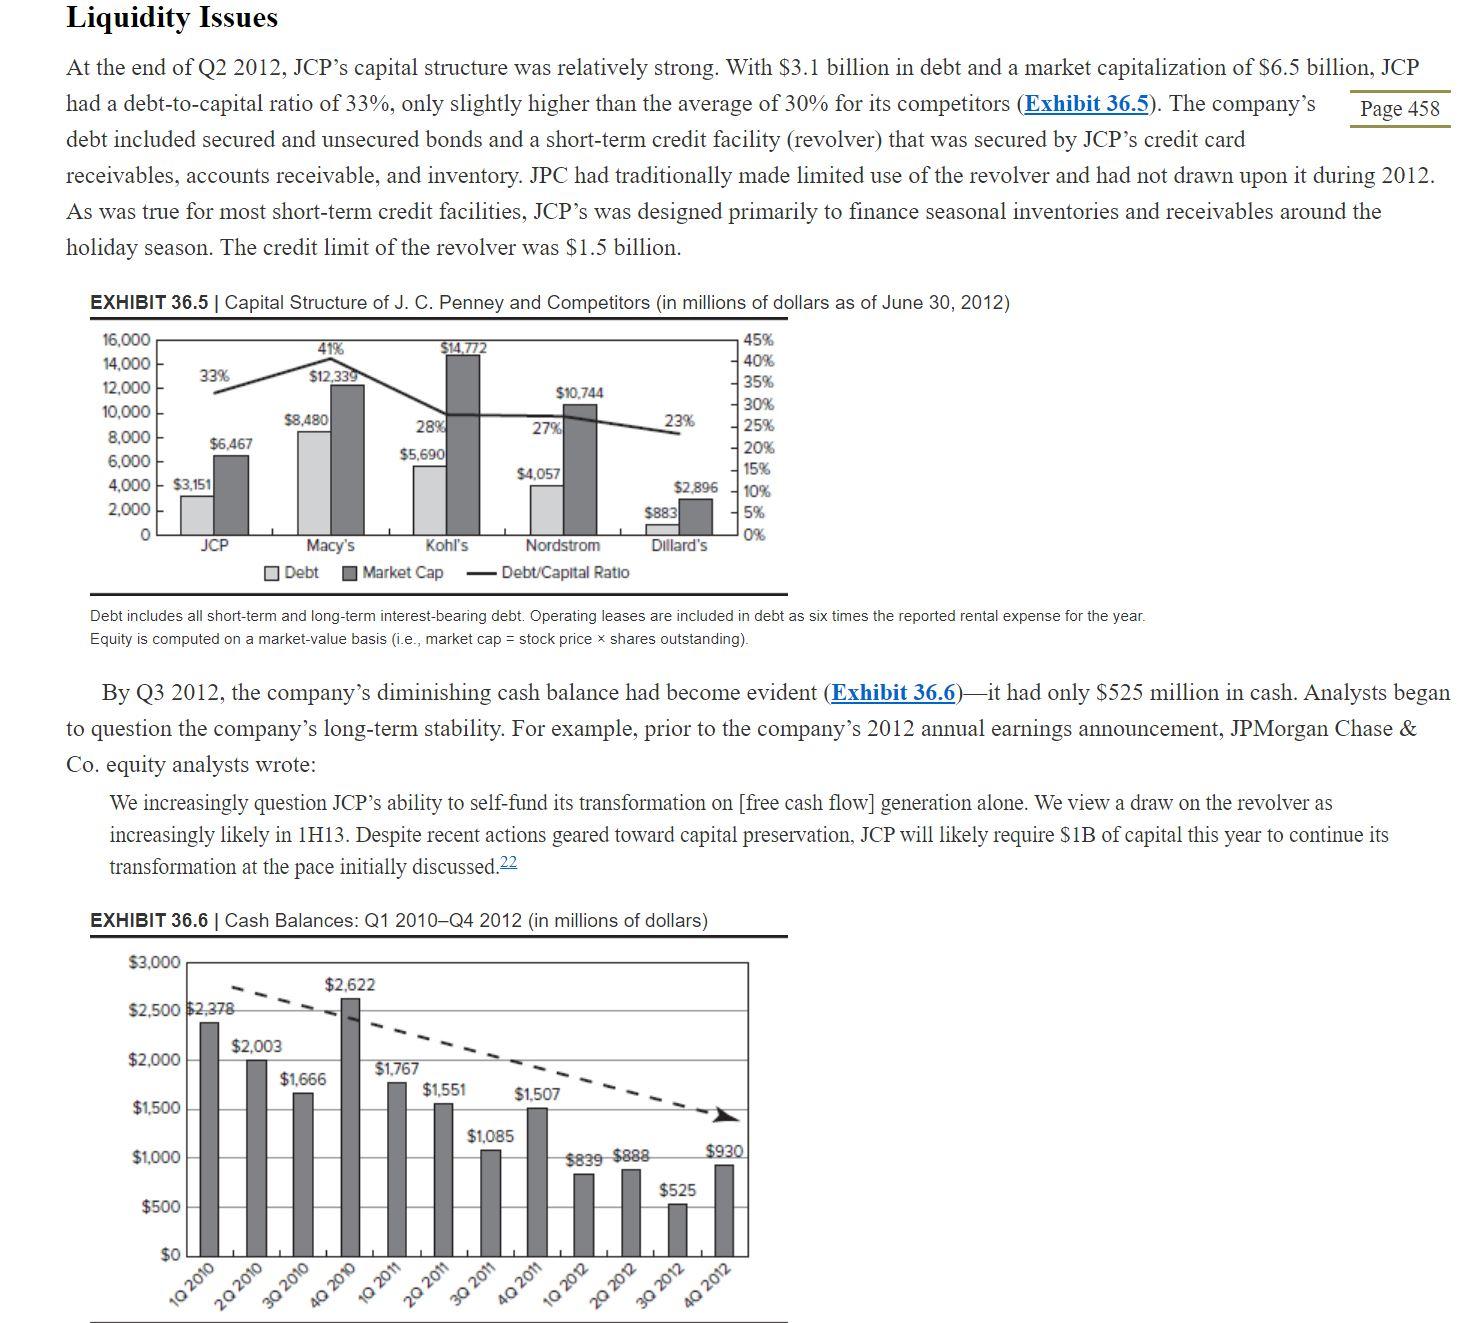
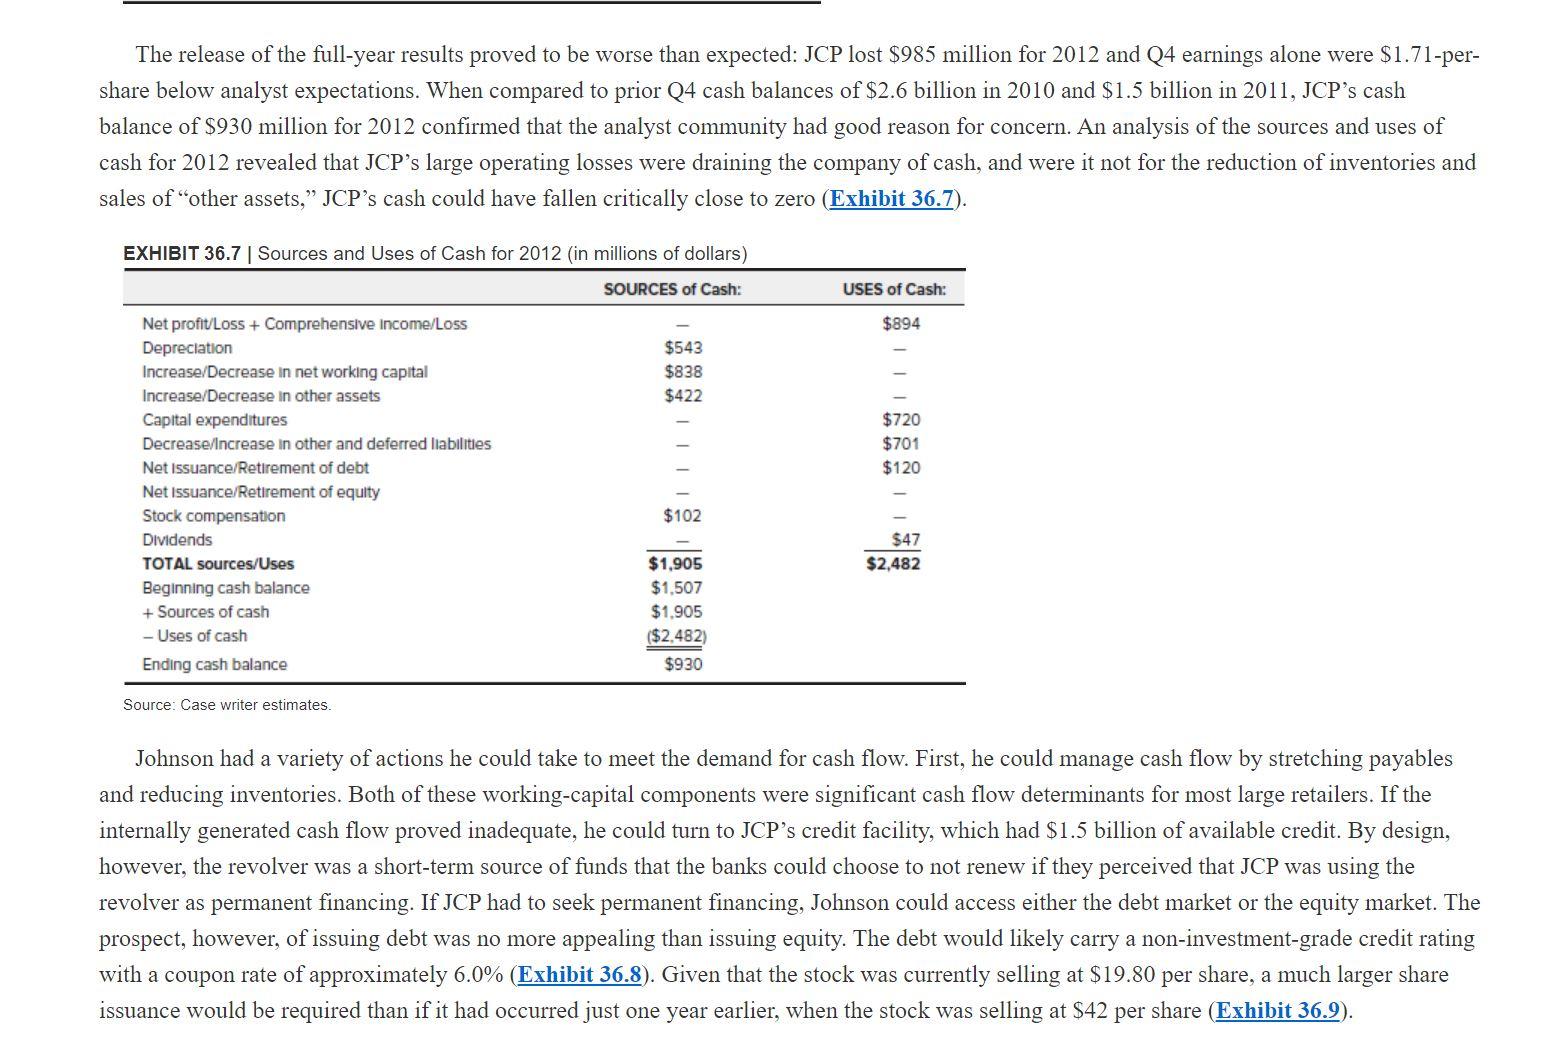
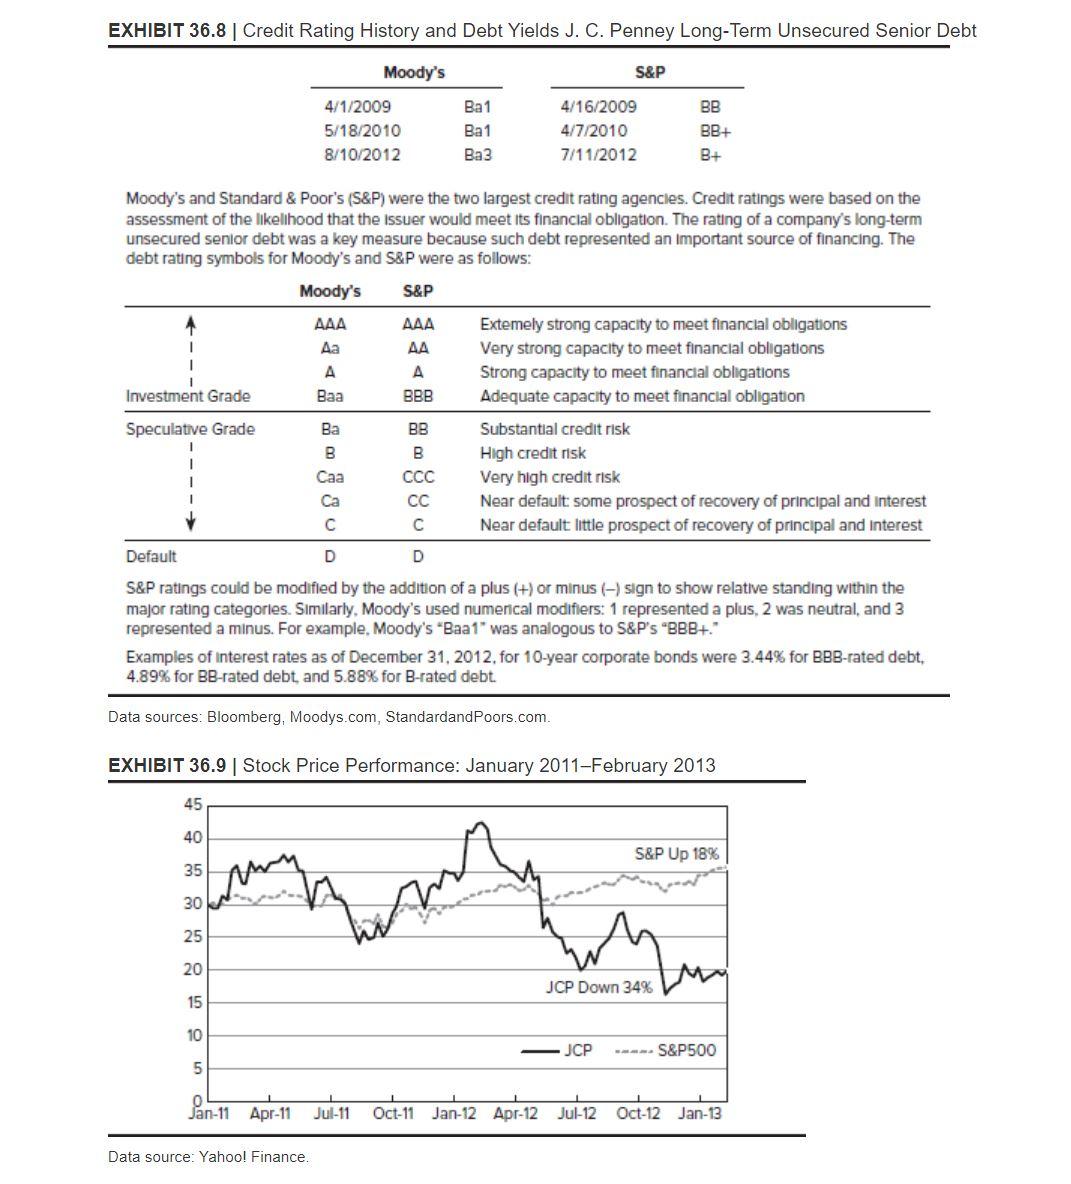
EXHIBIT 36.1 | Income Statements 2010-2012 (in millions of dollars, except per-share data) 2012 2011 2010 12.985 8.919 4,066 4,535 298 543 5,376 (1,310) 17.260 11,042 6.218 5.251 451 518 6.220 17.759 10.799 6,960 5,358 255 515 6,128 832 Total revenue Cost of revenue Gross profit Selling general and administrative Non recurring Others Total operating expenses Operating income or loss Income from continuing operations Total other income/expenses net Earnings before interest and taxes Interest expense Income before tax Income tax expense Net Income Wt. avg. shares for basic EPS-basic Weighted average shares-diluted Basic earnings per share Diluted earnings per share 0 0 (1.310) 226 (1.536) (551) (985) 219.2 219.2 ($4.49) ($4.49) (2) 227 (229) (77) (152) 217.4 217.4 ($0.70) ($0.70) 9 823 231 592 203 389 236.4 238.0 $1.64 $1.63 Data source: All exhibits, unless otherwise specified, include data sourced from J. C. Penney annual reports. EXHIBIT 36.2 Balance Sheets 2010-2012 (in millions of dollars) 2012 2011 2010 930 2.341 412 3,683 5.353 745 9,781 1.507 2.916 658 5,081 5.176 1.167 11,424 2.622 3.213 535 6,370 5,231 1,467 13,068 1,133 1,514 Assets Current assets Cash and cash equivalents Inventory Prepaid and other Total current assets Property, plant, and equipment Other assets Total assets Llabilities Current liabilities Merchandise accounts payable Other accounts payable Short-term and current long-term debt Total current liabilities Long-term debt Other liabilities Deferred long-term liability charges Total llabilities Stockholders' equity Common stock Retained earnings Capital surplus Other stockholder equity Total stockholder equity Total liabilities and stockholders' equity 1.162 1.380 26 2,568 2.956 698 388 6,610 1.022 1.503 231 2,756 2.871 899 888 7,414 2,647 3,099 670 1,192 7,608 110 380 3.799 (1.118) 3,171 9,781 108 1,412 3.699 (1.209) 4,010 11,424 118 2,222 3,925 (805) 5,460 13,068 EXHIBIT 36.3 Quarterly Income Statements, 2011 and 2012 (in millions of dollars, except per-share data) Q4 2012 Q3 2012 Q2 2012 Q1 2012 Q4 2011 Q3 2011 Q2 2011 Q1 2011 3.884 2.960 924 2.927 1,975 952 3,022 2.018 1.004 3.152 1.966 1,186 5,425 3,788 1,637 3.986 2.497 1.489 3.906 2.409 1,497 3.943 2.348 1.595 Total revenue Cost of revenue Gross profit Operating expenses Selling, general and administrative Depreciation and amortization Other Total operating expenses Operating income Interest expense Income before tax Income tax expense Net Income Wt. avg. shares for basic EPS-basic Weighted average shares-diluted Basic earnings per share Diluted earnings per share 1,209 157 303 1.669 (745) 57 (802) (250) (552) 219.5 219.5 ($2.51) ($2.51) 1,087 133 (112) 1,108 (156) 55 (211) (88) (123) 219.4 219.4 ($0.56) ($0.56) 1.050 128 9 1.187 (183) 58 (241) (94) (147) 219.3 219.3 ($0.67) ($0.67) 1.160 125 127 1,412 (226) 56 (282) (119) (163) 218.3 218.3 ($0.75) ($0.75) 1.343 135 232 1.710 (73) 57 (130) (43) (87) 217.4 217.4 ($0.40) ($0.40) 1.242 127 291 1.660 (171) 55 (226) (83) (143) 213.3 213.3 ($0.67) ($0.67) 1,243 128 45 1,416 81 57 24 10 14 216 216 $0.06 $0.06 1.281 128 25 1.434 161 58 103 39 64 229.2 231.7 $0.28 $0.28 EXHIBIT 36.4 Quarterly Balance Sheets 2011-2012 (in millions of dollars) Q4 2012 Q3 2012 Q2 2012 Q1 2012 Q4 2011 Q3 2011 Q2 2011 Q1 2011 Assets Current assets Cash and cash equivalents Inventory Other current assets Total Current Assets Property, plant, and equipment Other assets Total assets 930 2.341 412 3,683 5.353 745 9.781 525 3,362 743 4,630 5,493 767 10,890 888 2993 855 4,736 5,153 923 10,812 839 3084 759 4,682 5.126 1,231 11,039 1507 2916 658 5,081 5.176 1.167 11,424 1085 4376 649 6,110 5.242 1.399 12,751 1551 3572 528 5,651 5,237 1,541 12,429 1767 3408 458 5,633 5.226 1.515 12,374 1,408 984 1.222 1.386 1.381 1,344 231 0 1.162 1.380 26 2,568 2.956 698 388 6,610 Llabilities Current liabilities Merchandise accounts payable Other accounts payable Short-term and current long-term debt Total current liabilities Long-term debt Other liabilities Deferred long-term liability charges Total liabilities Stockholders' equity Common stock Retained earnings Capital surplus Other stockholder equity Total stockholder equity Total liabilities and stockholders' equity 2,437 2.871 1,015 1,219 250 2,484 2901 852 904 7,141 22 2,774 2.943 885 786 7,388 1,022 1,503 231 2.756 2,871 899 888 7,414 1.831 1,404 231 3,466 2.871 740 1.152 8,229 871 1.274 1.396 0 2,670 3,099 646 1.208 7,623 2,767 3,099 644 1,216 7.726 924 7,103 110 109 109 108 107 108 932 1,819 3.587 110 380 3.799 (1.118) 3,171 9,781 1,057 3,782 (1.277) 3,671 10,812 3789 (1.329) 3,502 10,890 1,204 3,767 (1,144) 3,936 11,039 1.412 3,699 (1.209) 4,010 11,424 107 1.541 3.619 (745) 4,522 12,751 1.728 3,605 (737) 4,703 12,429 (763) 4.751 12,374 Despite Johnson's plans, there were rumors among Wall Street analysts that the company was facing significant liquidity issues and perhaps the possibility of bankruptcy. Sales and profits were continuing to decline and the dividend had been eliminated. Just two days earlier, a Wall Street equity analyst had recommended investors sell their JCP stock by stating, Cash flow is weak and could become critical. At current burn ratesand absent any further asset saleswe estimate that J. C. Penney will be virtually out of cash by fiscal year-end 2013.2 On top of that, JCP was dealing with allegations that the company was defaulting on its 7.4% debentures, which were due in 2037. Although JCP management had responded that the default allegations were invalid, the rumors of the company's liquidity problems continued to circulate and analysts wanted assurance that JCP had a financing plan in place in the event that an injection of cash became critical to the company's survival. Management Changes Despite Ullman's successful 2010 and Q1 2011 results, he announced he would be stepping down as CEO. Although Ullman retained his position as executive chairman, Ron Johnson of Apple Inc.'s retail stores was hired as the new CEO. Johnson's success at Apple had been well documented. The New York Times described him as the man at Apple who had turned the boring computer sales floor into a sleek playroom filled with gadgets.":12 In an interview following the announcement, Johnson stated, "My lifetime dream has been to lead one of the large great retailers, to reimagine what it could be. In the U.S., the department store has a chance to regain its status as the leader in style, the leader in excitement. It will be a period of true innovation for this company. Ackman conveyed confidence in the management change by saying, Ron Johnson is the Steve Jobs of the retail industry."'13 JCP investors echoed Ackman's optimism as the stock rallied 17% upon the announcement of Johnson's appointment. JCP's board had created a compensation package to incentivize Johnson's performance that included a base salary of $375,000 and a performance-based bonus of $236,000. The board also awarded Johnson $50 million of restricted stock to offset the Apple stock options Johnson had forfeited when he accepted the JCP position.14 Through the rest of 2011, Johnson continued to make headlines by recruiting high-profile executives for his management team. The most noteworthy was the CMO, Michael Francis, who had held the same position at Target. Francis received a base salary of $1.2 million and $12 million as a sign-on cash bonus."15 In addition to Francis, Johnson hired Daniel Walker as his chief talent officer for $8 million and Michael Kramer as COO for $4 million in cash and $29 million in restricted stock. Results for Q3 2011 were disappointing: sales declined 4.8% compared to Q3 2010 and earnings fell to a $143 million loss. 16 As Page 457 JCP entered 2012 in a tenuous financial position, Johnson responded by announcing a "fair-and-square pricing strategy that eliminated all promotions in favor of everyday, regular prices."17 Having run 590 separate promotions in 2011, Johnson argued, We want customers to shop on their terms, not ours. By setting our store monthly and maintaining our best prices for an entire month, we feel confident that customers will love shopping when it is convenient for them, rather than when it is expedient for us."18 The new pricing strategy was met with skepticism. Pricing consultant Rafi Mohammed wrote in the Harvard Business Review that J. C. Penney lacks the differentiation to make this pricing strategy successful. J. C. Penney's products are fairly homogenous. When selling a relatively undifferentiated product, the only lever to generate higher sales is discounts. Even worse, if competitors drop prices on comparable products, J. C. Penney's hands are tiedit is a sitting duck that can't respond."19 By Q1 2012, JCP's financial condition was showing signs of rapid deterioration as sales dropped 20% relative to Q1 2011 and losses hit 75 cents per share.20 Johnson announced a 10% reduction of the work force and that the dividend that had been paid since 1987 would be discontinued. The dividend cut was a clear signal to Wall Street that the company was experiencing significant liquidity concerns. As retail equities analyst Brian Sozzi observed, The dividend cut makes you lose shareholder support. And it also makes you wonder, [does JCP] have the balance sheet to fund this massive transformation of the business over the next two to three years?'21 In June 2012, with sales declining and the share price sliding toward $20 a share, Johnson's key hire, CMO Francis, resigned. After only nine months at the company, Francis left with a $12 million bonus in his pocket. Liquidity Issues At the end of Q2 2012, JCP's capital structure was relatively strong. With $3.1 billion in debt and a market capitalization of $6.5 billion, JCP had a debt-to-capital ratio of 33%, only slightly higher than the average of 30% for its competitors (Exhibit 36.5). The company's Page 458 debt included secured and unsecured bonds and a short-term credit facility (revolver) that was secured by JCP's credit card receivables, accounts receivable, and inventory. JPC had traditionally made limited use of the revolver and had not drawn upon it during 2012. As was true for most short-term credit facilities, JCP's was designed primarily to finance seasonal inventories and receivables around the holiday season. The credit limit of the revolver was $1.5 billion. EXHIBIT 36.5 | Capital Structure of J. C. Penney and Competitors (in millions of dollars as of June 30, 2012) 41% $14.772 33% $12,339 $10.744 16.000 14,000 12.000 10.000 8.000 6.000 4,000 2,000 $8,480 28% 23% 27% 45% 40% 35% 30% 25% 20% 15% 10% 5% 0% $6,467 $5,690 $4,057 $3.151 $2.896 $8831 0 JCP Dillard's Macy's Kohl's Nordstrom Debt Market Cap -Debt/Capital Ratio Debt includes all short-term and long-term interest-bearing debt. Operating leases are included in debt as six times the reported rental expense for the year. Equity is computed on a market value basis (i.e., market cap = stock price x shares outstanding) By Q3 2012, the company's diminishing cash balance had become evident (Exhibit 36.6)it had only $525 million in cash. Analysts began to question the company's long-term stability. For example, prior to the company's 2012 annual earnings announcement, JPMorgan Chase & Co. equity analysts wrote: We increasingly question JCP's ability to self-fund its transformation on [free cash flow] generation alone. We view a draw on the revolver as increasingly likely in 1H13. Despite recent actions geared toward capital preservation, JCP will likely require $1B of capital this year to continue its transformation at the pace initially discussed.22 EXHIBIT 36.6 Cash Balances: Q1 2010-Q4 2012 (in millions of dollars) $3,000 $2,622 $2,500 $2,378 $2,003 $2.000 H $1,666 $1,767 $1,551 $1,507 $1,500 $1,085 $930 $1,000 $839 $888 $525 $500 $0 20 2010 40 2010 30 2010 10 2011 20 2012 30 2012 10 2010 20 2011 10 2012 40 2012 30 2011 40 2011 The release of the full-year results proved to be worse than expected: JCP lost $985 million for 2012 and Q4 earnings alone were $1.71-per- share below analyst expectations. When compared to prior Q4 cash balances of $2.6 billion in 2010 and $1.5 billion in 2011, JCP's cash balance of $930 million for 2012 confirmed that the analyst community had good reason for concern. An analysis of the sources and uses of cash for 2012 revealed that JCP's large operating losses were draining the company of cash, and were it not for the reduction of inventories and sales of other assets, JCP's cash could have fallen critically close to zero (Exhibit 36.7). EXHIBIT 36.7 | Sources and Uses of Cash for 2012 (in millions of dollars) SOURCES of Cash: USES of Cash: $894 $543 $838 $422 $720 $701 $120 Net profit/Loss + Comprehensive Income/Loss Depreciation Increase/Decrease in net working capital Increase/Decrease in other assets Capital expenditures Decrease/Increase in other and deferred liabilities Net Issuance/Retirement of debt Net Issuance/Retirement of equity Stock compensation Dividends TOTAL sources/Uses Beginning cash balance + Sources of cash - Uses of cash Ending cash balance $102 $47 $2,482 $1,905 $1.507 $1.905 ($2,482) $930 Source: Case writer estimates. Johnson had a variety of actions he could take to meet the demand for cash flow. First, he could manage cash flow by stretching payables and reducing inventories. Both of these working-capital components were significant cash flow determinants for most large retailers. If the internally generated cash flow proved inadequate, he could turn to JCP's credit facility, which had $1.5 billion of available credit. By design, however, the revolver was a short-term source of funds that the banks could choose to not renew if they perceived that JCP was using the revolver as permanent financing. If JCP had to seek permanent financing, Johnson could access either the debt market or the equity market. The prospect, however, of issuing debt was no more appealing than issuing equity. The debt would likely carry a non-investment-grade credit rating with a coupon rate of approximately 6.0% (Exhibit 36.8). Given that the stock was currently selling at $19.80 per share, a much larger share issuance would be required than if it had occurred just one year earlier, when the stock was selling at $42 per share (Exhibit 36.9). EXHIBIT 36.8 Credit Rating History and Debt Yields J. C. Penney Long-Term Unsecured Senior Debt Moody's S&P 4/1/2009 5/18/2010 8/10/2012 Ba1 Ba1 Ba3 4/16/2009 4/7/2010 7/11/2012 BB BB+ B+ Moody's and Standard & Poor's (S&P) were the two largest credit rating agencies. Credit ratings were based on the assessment of the likelihood that the issuer would meet its financial obligation. The rating of a company's long-term unsecured senior debt was a key measure because such debt represented an important source of financing. The debt rating symbols for Moody's and S&P were as follows: Moody's S&P AAA AAA Extemely strong capacity to meet financial obligations Aa AA Very strong capacity to meet financial obligations A A Strong capacity to meet financial obligations Investment Grade Baa BBB Adequate capacity to meet financial obligation Speculative Grade Ba BB Substantial credit risk B B High credit risk Caa Very high credit risk CC Near default some prospect of recovery of principal and interest Near default little prospect of recovery of principal and interest Default D D S&P ratings could be modified by the addition of a plus (+) or minus (-) sign to show relative standing within the major rating categories. Similarly, Moody's used numerical modifiers: 1 represented a plus, 2 was neutral, and 3 represented a minus. For example, Moody's *Baa1" was analogous to S&P's "BBB+." Examples of interest rates as of December 31, 2012, for 10-year corporate bonds were 3.44% for BBB-rated debt, 4.89% for BB-rated debt and 5.88% for B-rated debt. Data sources: Bloomberg, Moodys.com, StandardandPoors.com. EXHIBIT 36.9 | Stock Price Performance: January 2011-February 2013 45 40 S&P Up 18% 35 30 um 25 20 JCP Down 34% 15 10 JCP S&P500 5 Jan-11 Apr-11 Jul-11 Oct-11 Jan 12 Apr-12 Jul-12 Oct-12 Jan-13 Data source: Yahoo! Finance. EXHIBIT 36.1 | Income Statements 2010-2012 (in millions of dollars, except per-share data) 2012 2011 2010 12.985 8.919 4,066 4,535 298 543 5,376 (1,310) 17.260 11,042 6.218 5.251 451 518 6.220 17.759 10.799 6,960 5,358 255 515 6,128 832 Total revenue Cost of revenue Gross profit Selling general and administrative Non recurring Others Total operating expenses Operating income or loss Income from continuing operations Total other income/expenses net Earnings before interest and taxes Interest expense Income before tax Income tax expense Net Income Wt. avg. shares for basic EPS-basic Weighted average shares-diluted Basic earnings per share Diluted earnings per share 0 0 (1.310) 226 (1.536) (551) (985) 219.2 219.2 ($4.49) ($4.49) (2) 227 (229) (77) (152) 217.4 217.4 ($0.70) ($0.70) 9 823 231 592 203 389 236.4 238.0 $1.64 $1.63 Data source: All exhibits, unless otherwise specified, include data sourced from J. C. Penney annual reports. EXHIBIT 36.2 Balance Sheets 2010-2012 (in millions of dollars) 2012 2011 2010 930 2.341 412 3,683 5.353 745 9,781 1.507 2.916 658 5,081 5.176 1.167 11,424 2.622 3.213 535 6,370 5,231 1,467 13,068 1,133 1,514 Assets Current assets Cash and cash equivalents Inventory Prepaid and other Total current assets Property, plant, and equipment Other assets Total assets Llabilities Current liabilities Merchandise accounts payable Other accounts payable Short-term and current long-term debt Total current liabilities Long-term debt Other liabilities Deferred long-term liability charges Total llabilities Stockholders' equity Common stock Retained earnings Capital surplus Other stockholder equity Total stockholder equity Total liabilities and stockholders' equity 1.162 1.380 26 2,568 2.956 698 388 6,610 1.022 1.503 231 2,756 2.871 899 888 7,414 2,647 3,099 670 1,192 7,608 110 380 3.799 (1.118) 3,171 9,781 108 1,412 3.699 (1.209) 4,010 11,424 118 2,222 3,925 (805) 5,460 13,068 EXHIBIT 36.3 Quarterly Income Statements, 2011 and 2012 (in millions of dollars, except per-share data) Q4 2012 Q3 2012 Q2 2012 Q1 2012 Q4 2011 Q3 2011 Q2 2011 Q1 2011 3.884 2.960 924 2.927 1,975 952 3,022 2.018 1.004 3.152 1.966 1,186 5,425 3,788 1,637 3.986 2.497 1.489 3.906 2.409 1,497 3.943 2.348 1.595 Total revenue Cost of revenue Gross profit Operating expenses Selling, general and administrative Depreciation and amortization Other Total operating expenses Operating income Interest expense Income before tax Income tax expense Net Income Wt. avg. shares for basic EPS-basic Weighted average shares-diluted Basic earnings per share Diluted earnings per share 1,209 157 303 1.669 (745) 57 (802) (250) (552) 219.5 219.5 ($2.51) ($2.51) 1,087 133 (112) 1,108 (156) 55 (211) (88) (123) 219.4 219.4 ($0.56) ($0.56) 1.050 128 9 1.187 (183) 58 (241) (94) (147) 219.3 219.3 ($0.67) ($0.67) 1.160 125 127 1,412 (226) 56 (282) (119) (163) 218.3 218.3 ($0.75) ($0.75) 1.343 135 232 1.710 (73) 57 (130) (43) (87) 217.4 217.4 ($0.40) ($0.40) 1.242 127 291 1.660 (171) 55 (226) (83) (143) 213.3 213.3 ($0.67) ($0.67) 1,243 128 45 1,416 81 57 24 10 14 216 216 $0.06 $0.06 1.281 128 25 1.434 161 58 103 39 64 229.2 231.7 $0.28 $0.28 EXHIBIT 36.4 Quarterly Balance Sheets 2011-2012 (in millions of dollars) Q4 2012 Q3 2012 Q2 2012 Q1 2012 Q4 2011 Q3 2011 Q2 2011 Q1 2011 Assets Current assets Cash and cash equivalents Inventory Other current assets Total Current Assets Property, plant, and equipment Other assets Total assets 930 2.341 412 3,683 5.353 745 9.781 525 3,362 743 4,630 5,493 767 10,890 888 2993 855 4,736 5,153 923 10,812 839 3084 759 4,682 5.126 1,231 11,039 1507 2916 658 5,081 5.176 1.167 11,424 1085 4376 649 6,110 5.242 1.399 12,751 1551 3572 528 5,651 5,237 1,541 12,429 1767 3408 458 5,633 5.226 1.515 12,374 1,408 984 1.222 1.386 1.381 1,344 231 0 1.162 1.380 26 2,568 2.956 698 388 6,610 Llabilities Current liabilities Merchandise accounts payable Other accounts payable Short-term and current long-term debt Total current liabilities Long-term debt Other liabilities Deferred long-term liability charges Total liabilities Stockholders' equity Common stock Retained earnings Capital surplus Other stockholder equity Total stockholder equity Total liabilities and stockholders' equity 2,437 2.871 1,015 1,219 250 2,484 2901 852 904 7,141 22 2,774 2.943 885 786 7,388 1,022 1,503 231 2.756 2,871 899 888 7,414 1.831 1,404 231 3,466 2.871 740 1.152 8,229 871 1.274 1.396 0 2,670 3,099 646 1.208 7,623 2,767 3,099 644 1,216 7.726 924 7,103 110 109 109 108 107 108 932 1,819 3.587 110 380 3.799 (1.118) 3,171 9,781 1,057 3,782 (1.277) 3,671 10,812 3789 (1.329) 3,502 10,890 1,204 3,767 (1,144) 3,936 11,039 1.412 3,699 (1.209) 4,010 11,424 107 1.541 3.619 (745) 4,522 12,751 1.728 3,605 (737) 4,703 12,429 (763) 4.751 12,374 Despite Johnson's plans, there were rumors among Wall Street analysts that the company was facing significant liquidity issues and perhaps the possibility of bankruptcy. Sales and profits were continuing to decline and the dividend had been eliminated. Just two days earlier, a Wall Street equity analyst had recommended investors sell their JCP stock by stating, Cash flow is weak and could become critical. At current burn ratesand absent any further asset saleswe estimate that J. C. Penney will be virtually out of cash by fiscal year-end 2013.2 On top of that, JCP was dealing with allegations that the company was defaulting on its 7.4% debentures, which were due in 2037. Although JCP management had responded that the default allegations were invalid, the rumors of the company's liquidity problems continued to circulate and analysts wanted assurance that JCP had a financing plan in place in the event that an injection of cash became critical to the company's survival. Management Changes Despite Ullman's successful 2010 and Q1 2011 results, he announced he would be stepping down as CEO. Although Ullman retained his position as executive chairman, Ron Johnson of Apple Inc.'s retail stores was hired as the new CEO. Johnson's success at Apple had been well documented. The New York Times described him as the man at Apple who had turned the boring computer sales floor into a sleek playroom filled with gadgets.":12 In an interview following the announcement, Johnson stated, "My lifetime dream has been to lead one of the large great retailers, to reimagine what it could be. In the U.S., the department store has a chance to regain its status as the leader in style, the leader in excitement. It will be a period of true innovation for this company. Ackman conveyed confidence in the management change by saying, Ron Johnson is the Steve Jobs of the retail industry."'13 JCP investors echoed Ackman's optimism as the stock rallied 17% upon the announcement of Johnson's appointment. JCP's board had created a compensation package to incentivize Johnson's performance that included a base salary of $375,000 and a performance-based bonus of $236,000. The board also awarded Johnson $50 million of restricted stock to offset the Apple stock options Johnson had forfeited when he accepted the JCP position.14 Through the rest of 2011, Johnson continued to make headlines by recruiting high-profile executives for his management team. The most noteworthy was the CMO, Michael Francis, who had held the same position at Target. Francis received a base salary of $1.2 million and $12 million as a sign-on cash bonus."15 In addition to Francis, Johnson hired Daniel Walker as his chief talent officer for $8 million and Michael Kramer as COO for $4 million in cash and $29 million in restricted stock. Results for Q3 2011 were disappointing: sales declined 4.8% compared to Q3 2010 and earnings fell to a $143 million loss. 16 As Page 457 JCP entered 2012 in a tenuous financial position, Johnson responded by announcing a "fair-and-square pricing strategy that eliminated all promotions in favor of everyday, regular prices."17 Having run 590 separate promotions in 2011, Johnson argued, We want customers to shop on their terms, not ours. By setting our store monthly and maintaining our best prices for an entire month, we feel confident that customers will love shopping when it is convenient for them, rather than when it is expedient for us."18 The new pricing strategy was met with skepticism. Pricing consultant Rafi Mohammed wrote in the Harvard Business Review that J. C. Penney lacks the differentiation to make this pricing strategy successful. J. C. Penney's products are fairly homogenous. When selling a relatively undifferentiated product, the only lever to generate higher sales is discounts. Even worse, if competitors drop prices on comparable products, J. C. Penney's hands are tiedit is a sitting duck that can't respond."19 By Q1 2012, JCP's financial condition was showing signs of rapid deterioration as sales dropped 20% relative to Q1 2011 and losses hit 75 cents per share.20 Johnson announced a 10% reduction of the work force and that the dividend that had been paid since 1987 would be discontinued. The dividend cut was a clear signal to Wall Street that the company was experiencing significant liquidity concerns. As retail equities analyst Brian Sozzi observed, The dividend cut makes you lose shareholder support. And it also makes you wonder, [does JCP] have the balance sheet to fund this massive transformation of the business over the next two to three years?'21 In June 2012, with sales declining and the share price sliding toward $20 a share, Johnson's key hire, CMO Francis, resigned. After only nine months at the company, Francis left with a $12 million bonus in his pocket. Liquidity Issues At the end of Q2 2012, JCP's capital structure was relatively strong. With $3.1 billion in debt and a market capitalization of $6.5 billion, JCP had a debt-to-capital ratio of 33%, only slightly higher than the average of 30% for its competitors (Exhibit 36.5). The company's Page 458 debt included secured and unsecured bonds and a short-term credit facility (revolver) that was secured by JCP's credit card receivables, accounts receivable, and inventory. JPC had traditionally made limited use of the revolver and had not drawn upon it during 2012. As was true for most short-term credit facilities, JCP's was designed primarily to finance seasonal inventories and receivables around the holiday season. The credit limit of the revolver was $1.5 billion. EXHIBIT 36.5 | Capital Structure of J. C. Penney and Competitors (in millions of dollars as of June 30, 2012) 41% $14.772 33% $12,339 $10.744 16.000 14,000 12.000 10.000 8.000 6.000 4,000 2,000 $8,480 28% 23% 27% 45% 40% 35% 30% 25% 20% 15% 10% 5% 0% $6,467 $5,690 $4,057 $3.151 $2.896 $8831 0 JCP Dillard's Macy's Kohl's Nordstrom Debt Market Cap -Debt/Capital Ratio Debt includes all short-term and long-term interest-bearing debt. Operating leases are included in debt as six times the reported rental expense for the year. Equity is computed on a market value basis (i.e., market cap = stock price x shares outstanding) By Q3 2012, the company's diminishing cash balance had become evident (Exhibit 36.6)it had only $525 million in cash. Analysts began to question the company's long-term stability. For example, prior to the company's 2012 annual earnings announcement, JPMorgan Chase & Co. equity analysts wrote: We increasingly question JCP's ability to self-fund its transformation on [free cash flow] generation alone. We view a draw on the revolver as increasingly likely in 1H13. Despite recent actions geared toward capital preservation, JCP will likely require $1B of capital this year to continue its transformation at the pace initially discussed.22 EXHIBIT 36.6 Cash Balances: Q1 2010-Q4 2012 (in millions of dollars) $3,000 $2,622 $2,500 $2,378 $2,003 $2.000 H $1,666 $1,767 $1,551 $1,507 $1,500 $1,085 $930 $1,000 $839 $888 $525 $500 $0 20 2010 40 2010 30 2010 10 2011 20 2012 30 2012 10 2010 20 2011 10 2012 40 2012 30 2011 40 2011 The release of the full-year results proved to be worse than expected: JCP lost $985 million for 2012 and Q4 earnings alone were $1.71-per- share below analyst expectations. When compared to prior Q4 cash balances of $2.6 billion in 2010 and $1.5 billion in 2011, JCP's cash balance of $930 million for 2012 confirmed that the analyst community had good reason for concern. An analysis of the sources and uses of cash for 2012 revealed that JCP's large operating losses were draining the company of cash, and were it not for the reduction of inventories and sales of other assets, JCP's cash could have fallen critically close to zero (Exhibit 36.7). EXHIBIT 36.7 | Sources and Uses of Cash for 2012 (in millions of dollars) SOURCES of Cash: USES of Cash: $894 $543 $838 $422 $720 $701 $120 Net profit/Loss + Comprehensive Income/Loss Depreciation Increase/Decrease in net working capital Increase/Decrease in other assets Capital expenditures Decrease/Increase in other and deferred liabilities Net Issuance/Retirement of debt Net Issuance/Retirement of equity Stock compensation Dividends TOTAL sources/Uses Beginning cash balance + Sources of cash - Uses of cash Ending cash balance $102 $47 $2,482 $1,905 $1.507 $1.905 ($2,482) $930 Source: Case writer estimates. Johnson had a variety of actions he could take to meet the demand for cash flow. First, he could manage cash flow by stretching payables and reducing inventories. Both of these working-capital components were significant cash flow determinants for most large retailers. If the internally generated cash flow proved inadequate, he could turn to JCP's credit facility, which had $1.5 billion of available credit. By design, however, the revolver was a short-term source of funds that the banks could choose to not renew if they perceived that JCP was using the revolver as permanent financing. If JCP had to seek permanent financing, Johnson could access either the debt market or the equity market. The prospect, however, of issuing debt was no more appealing than issuing equity. The debt would likely carry a non-investment-grade credit rating with a coupon rate of approximately 6.0% (Exhibit 36.8). Given that the stock was currently selling at $19.80 per share, a much larger share issuance would be required than if it had occurred just one year earlier, when the stock was selling at $42 per share (Exhibit 36.9). EXHIBIT 36.8 Credit Rating History and Debt Yields J. C. Penney Long-Term Unsecured Senior Debt Moody's S&P 4/1/2009 5/18/2010 8/10/2012 Ba1 Ba1 Ba3 4/16/2009 4/7/2010 7/11/2012 BB BB+ B+ Moody's and Standard & Poor's (S&P) were the two largest credit rating agencies. Credit ratings were based on the assessment of the likelihood that the issuer would meet its financial obligation. The rating of a company's long-term unsecured senior debt was a key measure because such debt represented an important source of financing. The debt rating symbols for Moody's and S&P were as follows: Moody's S&P AAA AAA Extemely strong capacity to meet financial obligations Aa AA Very strong capacity to meet financial obligations A A Strong capacity to meet financial obligations Investment Grade Baa BBB Adequate capacity to meet financial obligation Speculative Grade Ba BB Substantial credit risk B B High credit risk Caa Very high credit risk CC Near default some prospect of recovery of principal and interest Near default little prospect of recovery of principal and interest Default D D S&P ratings could be modified by the addition of a plus (+) or minus (-) sign to show relative standing within the major rating categories. Similarly, Moody's used numerical modifiers: 1 represented a plus, 2 was neutral, and 3 represented a minus. For example, Moody's *Baa1" was analogous to S&P's "BBB+." Examples of interest rates as of December 31, 2012, for 10-year corporate bonds were 3.44% for BBB-rated debt, 4.89% for BB-rated debt and 5.88% for B-rated debt. Data sources: Bloomberg, Moodys.com, StandardandPoors.com. EXHIBIT 36.9 | Stock Price Performance: January 2011-February 2013 45 40 S&P Up 18% 35 30 um 25 20 JCP Down 34% 15 10 JCP S&P500 5 Jan-11 Apr-11 Jul-11 Oct-11 Jan 12 Apr-12 Jul-12 Oct-12 Jan-13 Data source: Yahoo! FinanceStep by Step Solution
There are 3 Steps involved in it
Step: 1

Get Instant Access to Expert-Tailored Solutions
See step-by-step solutions with expert insights and AI powered tools for academic success
Step: 2

Step: 3
Ace Your Homework with AI
Get the answers you need in no time with our AI-driven, step-by-step assistance
Get Started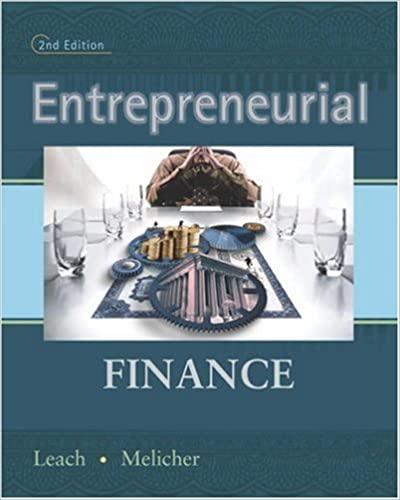
Entrepreneurial Finance
Authors: J. Chris Leach, Ronald W. Melicher
2nd Edition
0324289235, 9780324289237