Answered step by step
Verified Expert Solution
Question
1 Approved Answer
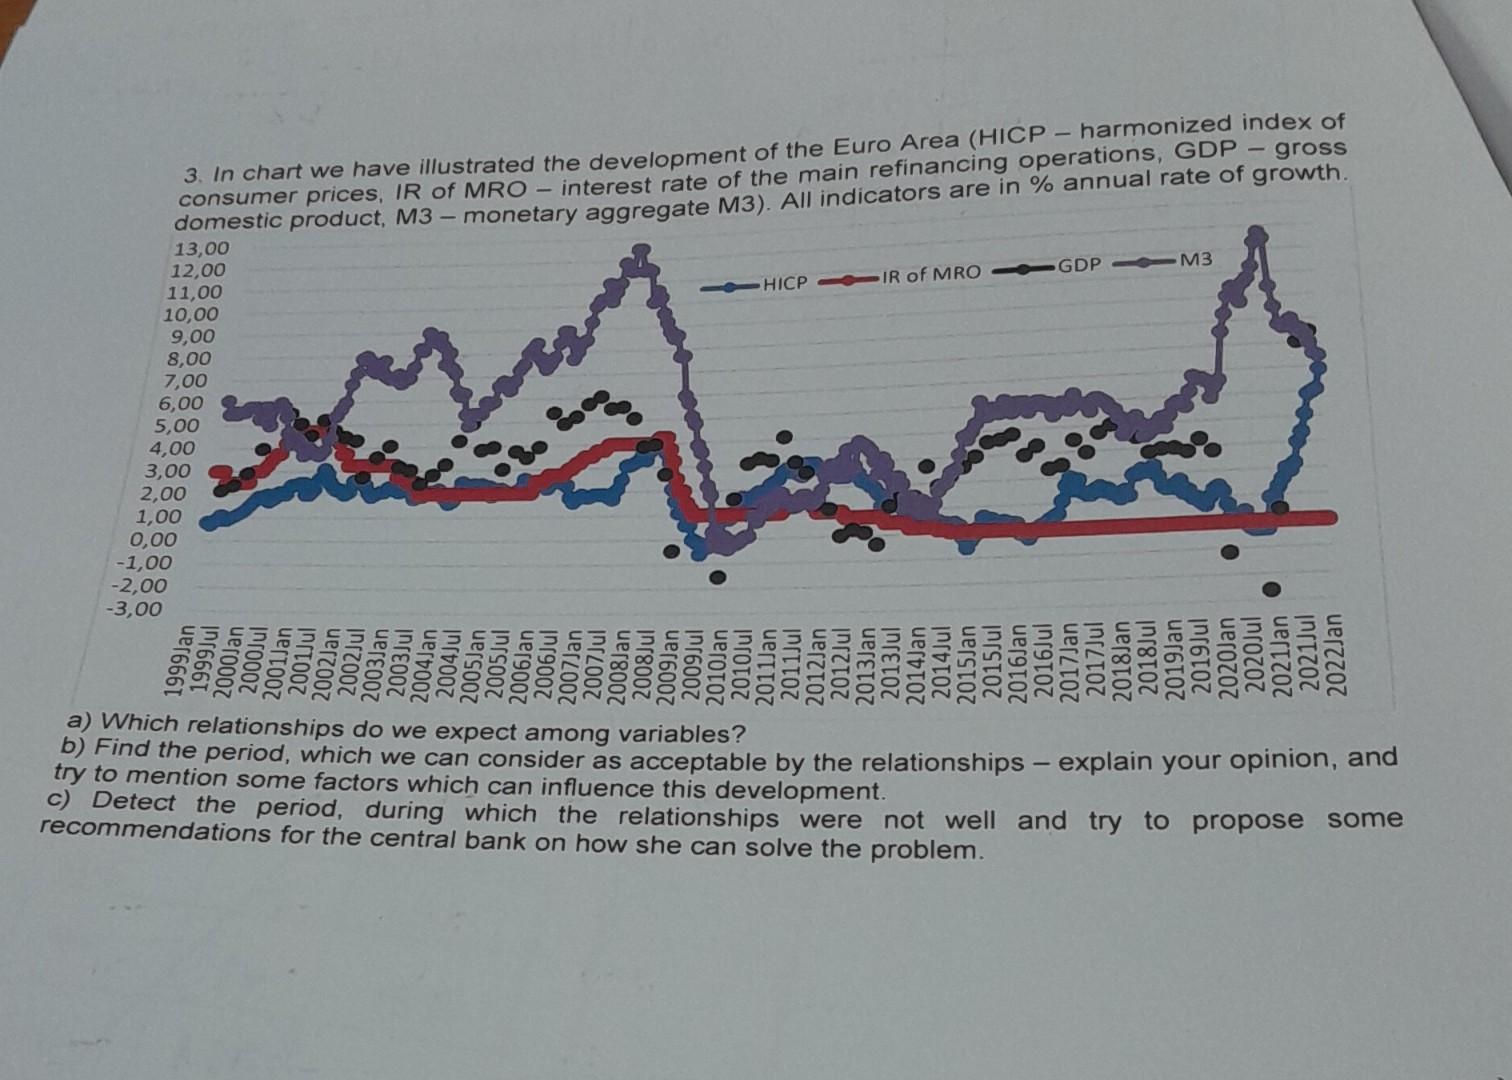
3. In chart we have illustrated the development of the Euro Area (HICP - harmonized index of consumer prices, IR of MRO - interest

3. In chart we have illustrated the development of the Euro Area (HICP - harmonized index of consumer prices, IR of MRO - interest rate of the main refinancing operations, GDP gross domestic product, M3 - monetary aggregate M3). All indicators are in % annual rate of growth. 13,00 12,00 11,00 10,00 9,00 8,00 7,00 6,00 5,00 4,00 3,00 2,00 1,00 0,00 -1,00 -2,00 -3,00 1999Jan 1999Jul HICP IR of MRO GDP M3 2020Jan 2020Jul 2021Jan 2021Jul 2022Jan a) Which relationships do we expect among variables? b) Find the period, which we can consider as acceptable by the relationships - explain your opinion, and try to mention some factors which can influence this development. c) Detect the period, during which the relationships were not well and try to propose some recommendations for the central bank on how she can solve the problem.
Step by Step Solution
★★★★★
3.31 Rating (157 Votes )
There are 3 Steps involved in it
Step: 1
the expected relationships among the variables HICP and IR There is a generally negative relationship between inflation HICP and interest rates IR Whe...
Get Instant Access to Expert-Tailored Solutions
See step-by-step solutions with expert insights and AI powered tools for academic success
Step: 2

Step: 3

Ace Your Homework with AI
Get the answers you need in no time with our AI-driven, step-by-step assistance
Get Started


