Question
3. In the photoelectric effect experiment, the graph of current vs battery voltage for a metal with light of a particular frequency shining on

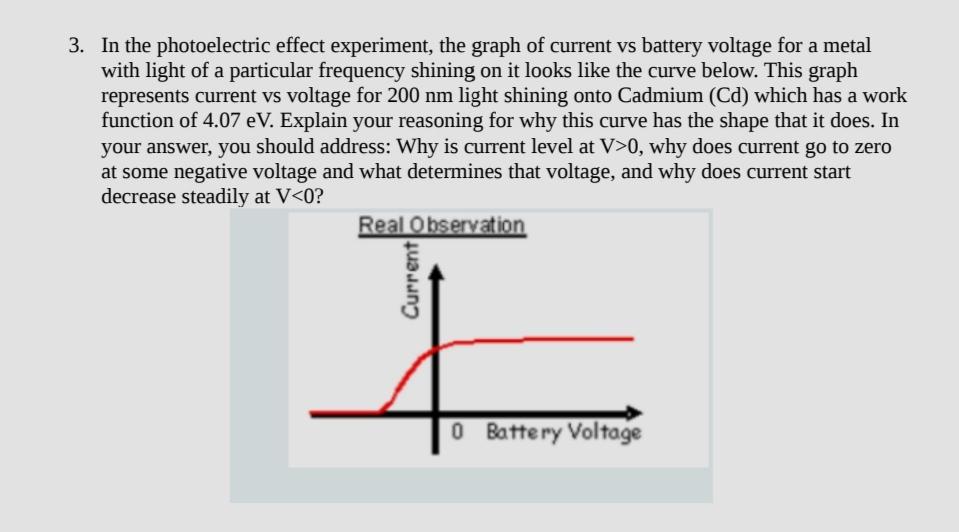
3. In the photoelectric effect experiment, the graph of current vs battery voltage for a metal with light of a particular frequency shining on it looks like the curve below. This graph represents current vs voltage for 200 nm light shining onto Cadmium (Cd) which has a work function of 4.07 eV. Explain your reasoning for why this curve has the shape that it does. In your answer, you should address: Why is current level at V>0, why does current go to zero at some negative voltage and what determines that voltage, and why does current start decrease steadily at V
Step by Step Solution
3.45 Rating (155 Votes )
There are 3 Steps involved in it
Step: 1
i the graph given sight side is current vs Voltage 13 grapp the graph fer ...
Get Instant Access to Expert-Tailored Solutions
See step-by-step solutions with expert insights and AI powered tools for academic success
Step: 2

Step: 3

Ace Your Homework with AI
Get the answers you need in no time with our AI-driven, step-by-step assistance
Get StartedRecommended Textbook for
Fundamentals of Physics
Authors: Jearl Walker, Halliday Resnick
8th Extended edition
471758019, 978-0471758013
Students also viewed these Physics questions
Question
Answered: 1 week ago
Question
Answered: 1 week ago
Question
Answered: 1 week ago
Question
Answered: 1 week ago
Question
Answered: 1 week ago
Question
Answered: 1 week ago
Question
Answered: 1 week ago
Question
Answered: 1 week ago
Question
Answered: 1 week ago
Question
Answered: 1 week ago
Question
Answered: 1 week ago
Question
Answered: 1 week ago
Question
Answered: 1 week ago
Question
Answered: 1 week ago
Question
Answered: 1 week ago
Question
Answered: 1 week ago
Question
Answered: 1 week ago
Question
Answered: 1 week ago
Question
Answered: 1 week ago
Question
Answered: 1 week ago
Question
Answered: 1 week ago
View Answer in SolutionInn App


