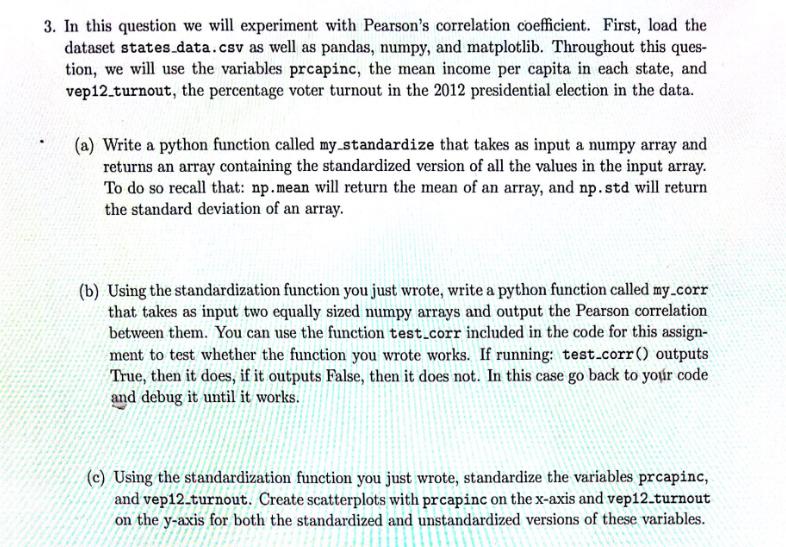
Question: 3. In this question we will experiment with Pearson's correlation coefficient. First, load the dataset states_data.csv as well as pandas, numpy, and matplotlib. Throughout


3. In this question we will experiment with Pearson's correlation coefficient. First, load the dataset states_data.csv as well as pandas, numpy, and matplotlib. Throughout this ques- tion, we will use the variables prcapinc, the mean income per capita in each state, and vep12_turnout, the percentage voter turnout in the 2012 presidential election in the data. (a) Write a python function called my standardize that takes as input a numpy array and returns an array containing the standardized version of all the values in the input array. To do so recall that: np. mean will return the mean of an array, and np. std will return the standard deviation of an array. (b) Using the standardization function you just wrote, write a python function called my_corr that takes as input two equally sized numpy arrays and output the Pearson correlation between them. You can use the function test_corr included in the code for this assign- ment to test whether the function you wrote works. If running: test-corr() outputs True, then it does, if it outputs False, then it does not. In this case go back to your code and debug it until it works. (c) Using the standardization function you just wrote, standardize the variables prcapinc, and vep12_turnout. Create scatterplots with prcapinc on the x-axis and vep12_turnout on the y-axis for both the standardized and unstandardized versions of these variables. (d) What do you observe in the scatterplots from the previous questions? Are the variables easier to compare once standardized? Briefly explain your answer. (e) Using your function, compute the correlation between the variables. Interpret this cor- relation and describe its implications.
Step by Step Solution
3.48 Rating (161 Votes )
There are 3 Steps involved in it
Answer Below is the Python code that addresses the requirements import pandas as pd import numpy as ... View full answer

Get step-by-step solutions from verified subject matter experts


