

Answered step by step
Verified Expert Solution
Question
1 Approved Answer
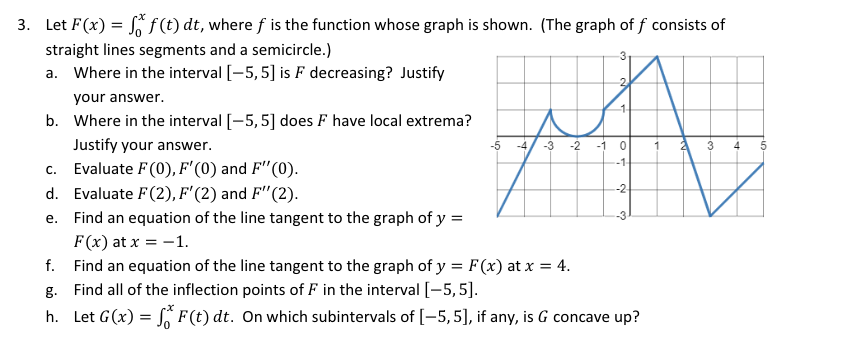
3. Let F(x) = So f(t) dt, where f is the function whose graph is shown. (The graph of f consists of straight lines segments

Step by Step Solution
There are 3 Steps involved in it
Step: 1

Get Instant Access to Expert-Tailored Solutions
See step-by-step solutions with expert insights and AI powered tools for academic success
Step: 2

Step: 3
Ace Your Homework with AI
Get the answers you need in no time with our AI-driven, step-by-step assistance
Get Started
Visualization And Processing Of Higher Order Descriptors For Multi-Valued Data
Authors: Ingrid Hotz, Thomas Schultz
1st Edition
3319150901, 9783319150901