Answered step by step
Verified Expert Solution
Link Copied!

Question

1 Approved Answer

(3 marks) 1. Add an appropriate x- and y-scale to the given graph so the graph represents the function y = 4 sin (5x). Don't
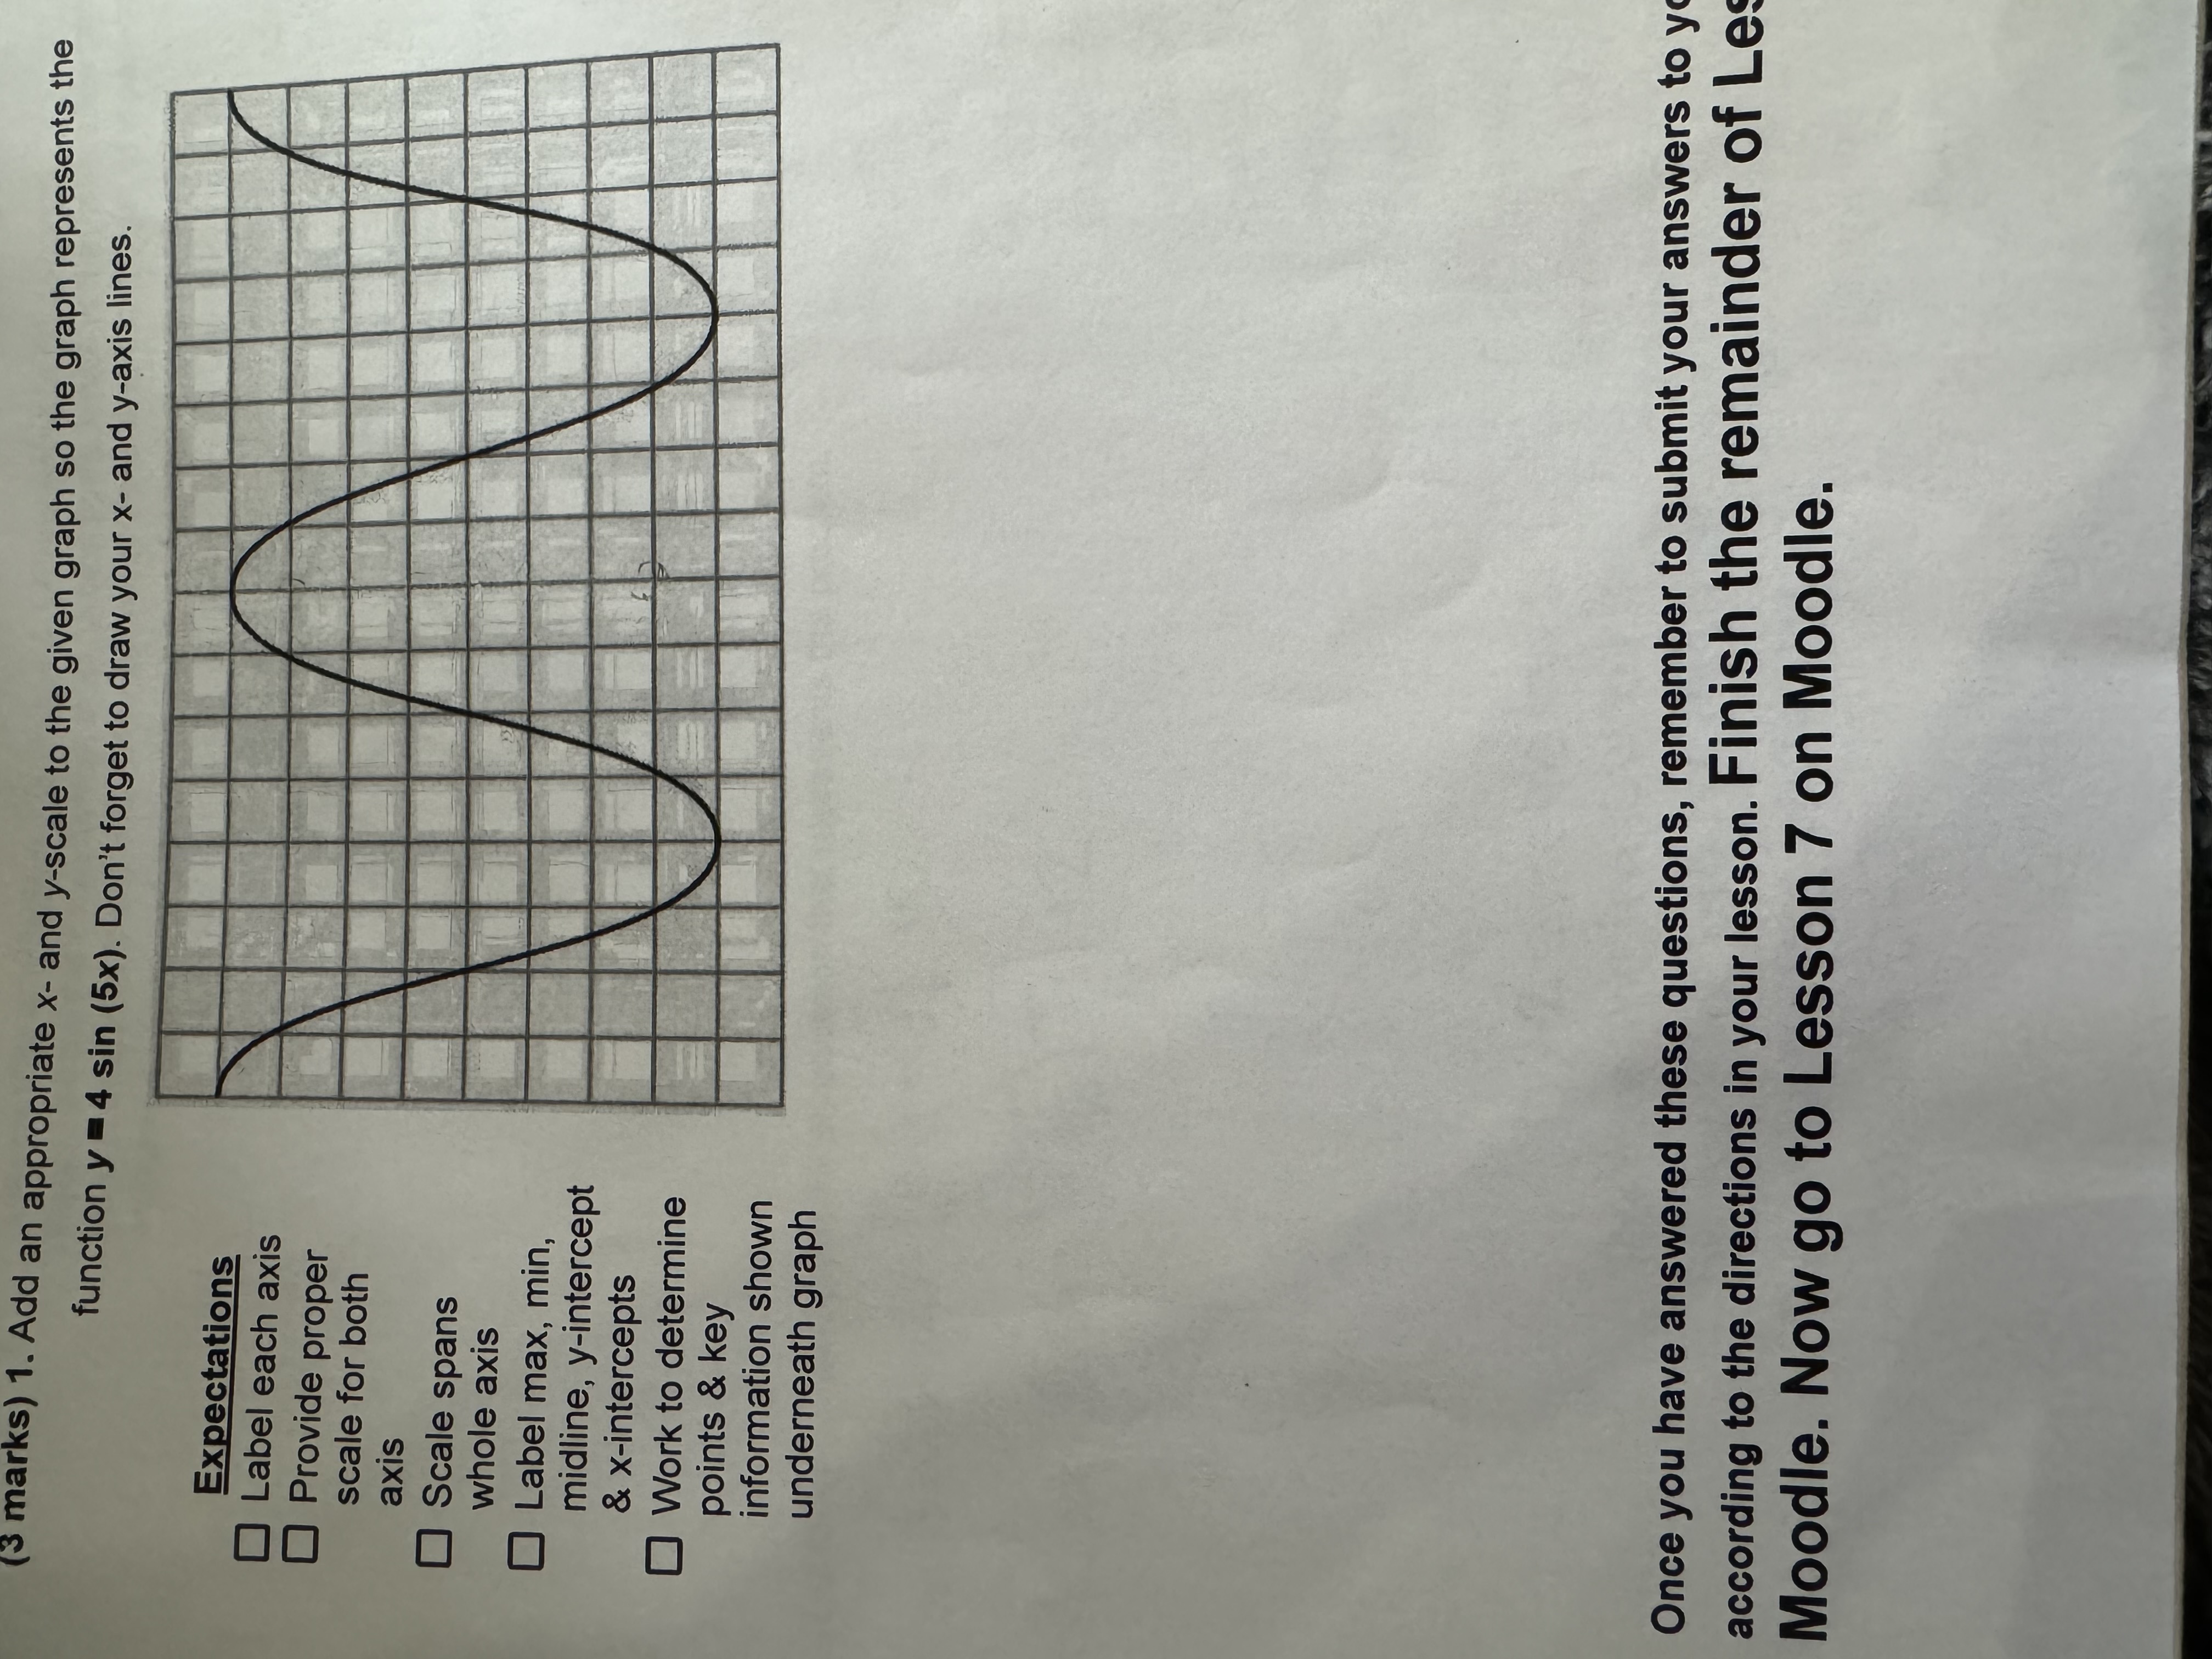
image text in transcribed
(3 marks) 1. Add an appropriate x- and y-scale to the given graph so the graph represents the function y = 4 sin (5x). Don't forget to draw your x- and y-axis lines. Expectations O Label each axis Provide proper scale for both axis Scale spans whole axis Label max, min, midline, y-intercept & X-intercepts Work to determine points & key information shown underneath graph Once you have answered these questions, remember to submit your answers to y according to the directions in your lesson. Finish the remainder of Les Moodle. Now go to Lesson 7 on Moodle

Step by Step Solution

There are 3 Steps involved in it

Step: 1

blur-text-image

Get Instant Access to Expert-Tailored Solutions

See step-by-step solutions with expert insights and AI powered tools for academic success

Step: 2

blur-text-image

Step: 3

blur-text-image

Ace Your Homework with AI

Get the answers you need in no time with our AI-driven, step-by-step assistance

Get Started

Recommended Textbook for

Advanced Engineering Mathematics

Authors: Erwin Kreyszig

6th Edition

978-0471858249, 0471858242

More Books

Students also viewed these Mathematics questions