Answered step by step
Verified Expert Solution
Link Copied!

Question

1 Approved Answer

3 Points Question 2 Q2) Month jan Feb Mar Apr May Jun- -Expected Demand 1400 -1100 1200 1650 -1650 -1700- Production Days -21 18 -18
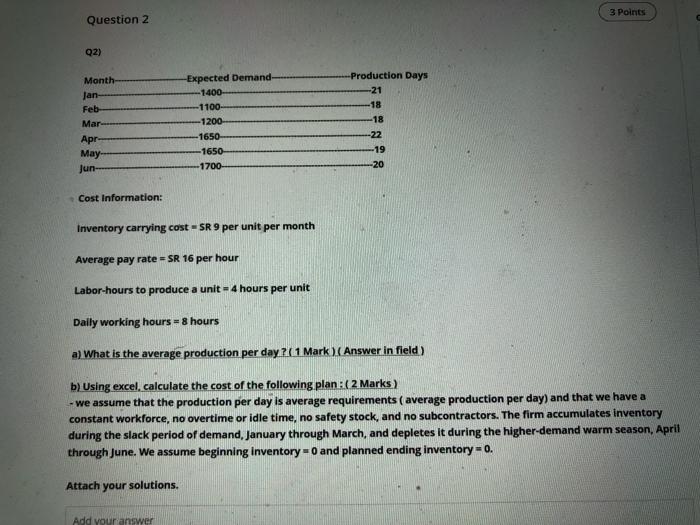
image text in transcribed
3 Points Question 2 Q2) Month jan Feb Mar Apr May Jun- -Expected Demand 1400 -1100 1200 1650 -1650 -1700- Production Days -21 18 -18 -22 -19 -20 Cost Information: Inventory carrying cost-SR 9 per unit per month Average pay rate=SR 16 per hour Labor-hours to produce a unit - 4 hours per unit Daily working hours = 8 hours a) What is the average production per day? 1 Mark Answer in field) b) Using excel, calculate the cost of the following plan:( 2 Marks) - we assume that the production per day is average requirements (average production per day) and that we have constant workforce, no overtime or idle time, no safety stock, and no subcontractors. The firm accumulates inventory during the slack period of demand, January through March, and depletes it during the higher-demand warm season, April through June. We assume beginning inventory = 0 and planned ending inventory = 0. Attach your solutions. Add your

Step by Step Solution

There are 3 Steps involved in it

Step: 1

blur-text-image

Get Instant Access to Expert-Tailored Solutions

See step-by-step solutions with expert insights and AI powered tools for academic success

Step: 2

blur-text-image

Step: 3

blur-text-image

Ace Your Homework with AI

Get the answers you need in no time with our AI-driven, step-by-step assistance

Get Started

Recommended Textbook for

Transportation Division Department Of Commerce Report On Preliminary Performance Audit Survey

Authors: Montana. Legislature. Office Of The Legi

1st Edition

1245445294, 978-1245445290

More Books

Students also viewed these Accounting questions