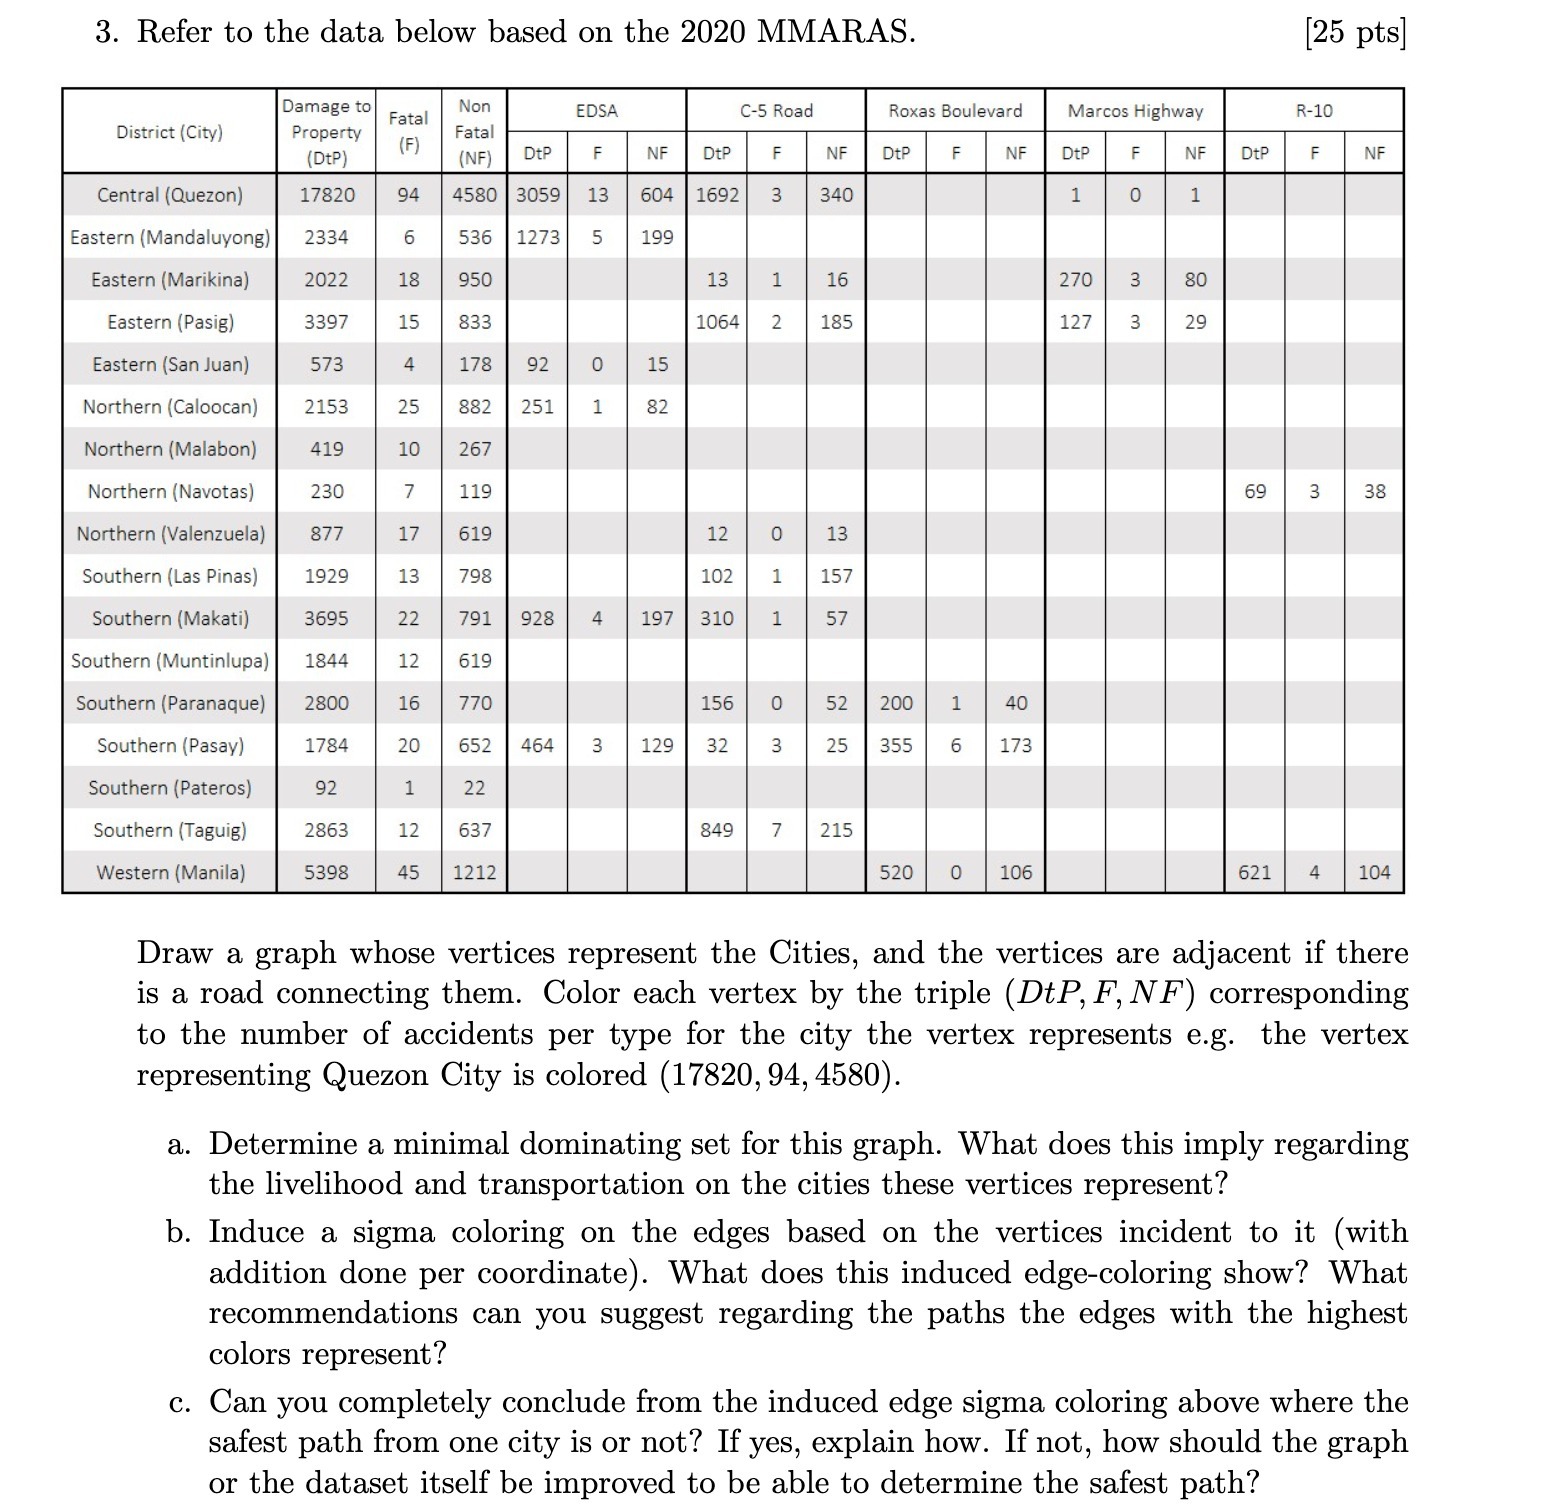
3. Refer to the data below based on the 2020 MMARAS. [25 pts] Damage to Non Fatal EDSA C-5 Road Roxas Boulevard Marcos Highway R-10 District (City) Property Fatal (F) (DtP) (NF) Dt NE Dte NF Dtp NF Dtp F NF Dtp NF Central (Quezon) 17820 94 4580 3059 13 04 1692 3 340 0 Eastern (Mandaluyong) 2334 6 536 1273 5 190 Eastern (Marikina) 2022 18 950 13 1 16 270 3 80 Eastern (Pasig) 339 15 833 1064 2 185 127 3 29 Eastern (San Juan) 573 4 178 92 0 15 Northern (Caloocan) 2153 25 882 251 1 82 Northern (Malabon) 419 10 267 Northern (Navotas) 230 7 119 69 3 38 Northern (Valenzuela 877 17 619 12 13 Southern (Las Pinas) 1929 13 798 102 1 157 Southern (Makati) 3695 22 791 928 4 197 310 1 57 Southern (Muntinlupa) 1844 12 619 Southern (Paranaque) 2800 16 770 156 0 52 200 1 40 Southern (Pasay) 1784 20 652 464 3 129 32 3 25 355 6 173 Southern (Pateros) 92 1 22 Southern (Taguig) 2863 12 62- 849 7 215 Western (Manila) 5398 45 1212 520 0 106 621 4 104 Draw a graph whose vertices represent the Cities, and the vertices are adjacent if there is a road connecting them. Color each vertex by the triple (DtP, F, NF) corresponding to the number of accidents per type for the city the vertex represents e.g. the vertex representing Quezon City is colored (17820, 94, 4580). a. Determine a minimal dominating set for this graph. What does this imply regarding the livelihood and transportation on the cities these vertices represent? b. Induce a sigma coloring on the edges based on the vertices incident to it (with addition done per coordinate). What does this induced edge-coloring show? What recommendations can you suggest regarding the paths the edges with the highest colors represent? c. Can you completely conclude from the induced edge sigma coloring above where the safest path from one city is or not? If yes, explain how. If not, how should the graph or the dataset itself be improved to be able to determine the safest path