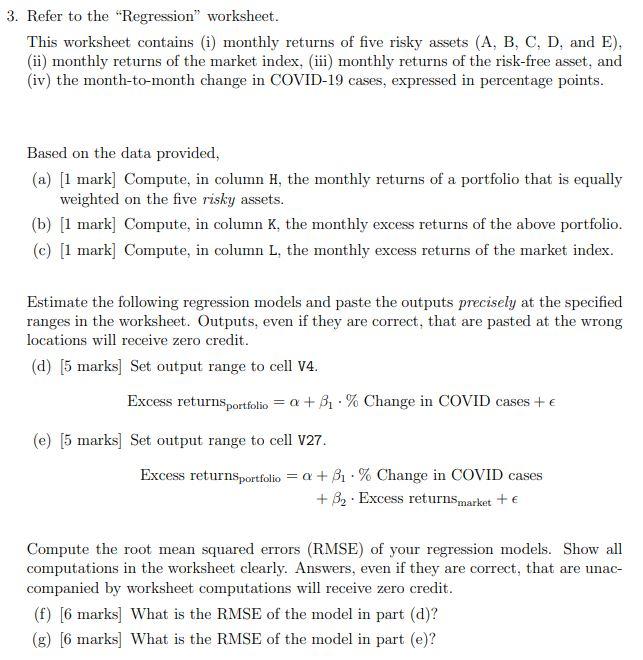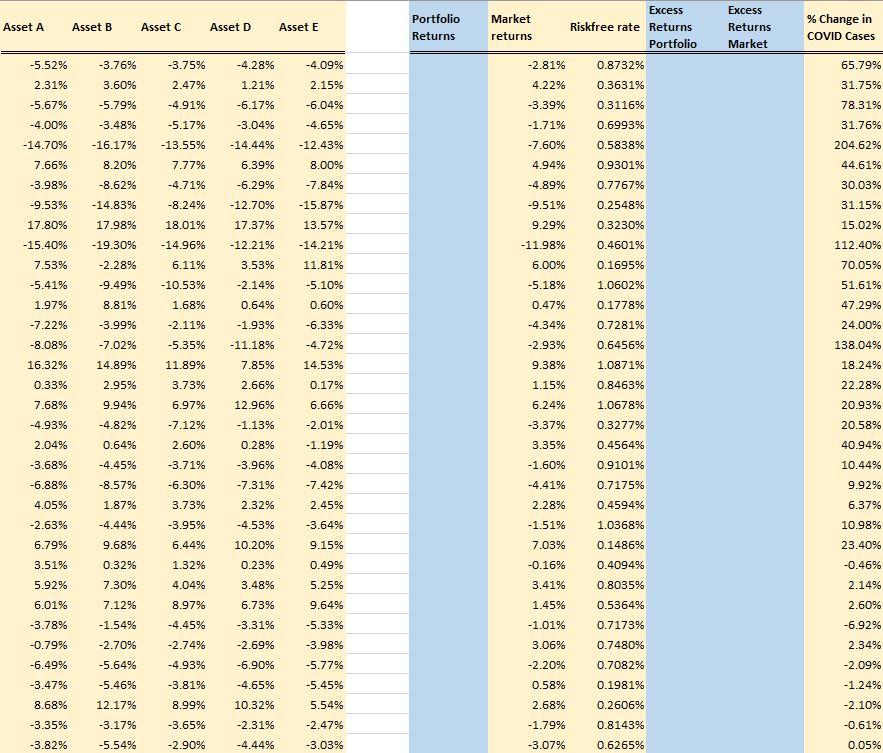

3. Refer to the "Regression worksheet. This worksheet contains (i) monthly returns of five risky assets (A, B, C, D, and E), (ii) monthly returns of the market index, (iii) monthly returns of the risk-free asset, and (iv) the month-to-month change in COVID-19 cases, expressed in percentage points. Based on the data provided, (a) [1 mark] Compute, in column H, the monthly returns of a portfolio that is equally weighted on the five risky assets. (b) [1 mark] Compute, in column K, the monthly excess returns of the above portfolio. (c) [1 mark] Compute, in column L, the monthly excess returns of the market index. Estimate the following regression models and paste the outputs precisely at the specified ranges in the worksheet. Outputs, even if they are correct, that are pasted at the wrong locations will receive zero credit. (d) (5 marks] Set output range to cell V4. Excess returns portfolio = a + B..% Change in COVID cases + e (e) [5 marks] Set output range to cell V27. Excess returnSportfolio = a + B1-% Change in COVID cases + B, . Excess returns market + Compute the root mean squared errors (RMSE) of your regression models. Show all computations in the worksheet clearly. Answers, even if they are correct, that are unac- companied by worksheet computations will receive zero credit. (f) [6 marks] What is the RMSE of the model in part (d)? (g) [6 marks] What is the RMSE of the model in part (e)? Excess Excess Portfolio Market % Change in Asset A Asset B Asset C Asset D Asset E Returns Returns returns Riskfree rate Returns Portfolio COVID Cases Market -5.52% -3.76% -3.75% -4.28% -4.099 -2.81% 0.8732% 65.79% 2.31% 3.60% 2.47% 1.21% 2.15% 4.22% 0.3631% 31.75% -5.67% -5.79% -4.91% -6.17% -6.04% -3.39% 0.3116% 78.31% -4.00% -3.48% -5.17% -3.04% -4.65% -1.71% 0.6993% 31.76% -14.70% -16.17% -13.55% -14.44% -12.43% -7.60% 0.5838% 204.62% 7.66% 8.20% 7.77% 6.39% 8.00% 4.94% 0.9301% 44.61% -3.98% -8.62% -4.71% -6.29% -7.84% -4.89% 0.7767% 30.03% -9.53% -14.83% -8.24% -12.70% -15.87% -9.51% 0.2548% 31.15% 17.80% 17.98% 18.01% 17.37% 13.57% 9.29% 0.3230% 15.02% -15.40% -19.30% -14.96% - 12.21% -14.21% -11.98% 0.4601% 112.40% 7.53% -2.28% 6.11% 3.53% 11.81% 6.00% 0.1695% 70.05% -5.41% -9.49% -10.53% -2.14% -5.10% -5.18% 1.0602% 51.61% 1.97% 8.81% 1.68% 0.64% 0.60% 0.47% 0.1778% 47.29% -7.22% -3.99% -2.11% -1.93% -6.33% -4.34% 0.7281% 24.00% -8.08% -7.02% -5.35% -11.18% -4.72% -2.93% 0.6456% 138.04% 16.32% 14.89% 11.89% 7.85% 14.53% 9.38% 1.0871% 18.24% 0.33% 2.95% 3.73% 2.66% 0.17% 1.15% 0.8463% 22.28% 7.68% 9.94% 6.97% 12.96% 6.66% 6.24% 1.0678% 20.93% -4.93% -4.82% -7.12% -1.13% -2.01% -3.37% 0.3277% 20.58% 2.04% 0.64% 2.60% 0.28% -1.19% 3.35% 0.4564% 40.94% -3.68% -4.45% -3.71% -3.96% -4.08% -1.60% 0.9101% 10.44% -6.88% -8.57% -6.30% -7.31% -7.42% -4.41% 0.7175% 9.92% 4.05% 1.87% 3.73% 2.32% 2.45% 2.28% 0.4594% 6.37% -2.63% -4.44% -3.95% -4.53% -3.64% -1.51% 1.0368% 10.98% 6.79% 9.68% 6.44% 10.20% 9.15% 7.03% 0.1486% 23.40% 3.51% 0.32% 1.32% 0.23% 0.49% -0.16% 0.4094% -0.46% 5.92% 7.30% 4.04% 3.48% 5.25% 3.41% 0.8035% 2.14% 6.01% 7.12% 8.97% 6.73% 9.64% 1.45% 0.5364% 2.60% -3.78% -1.54% -4.45% -3.31% -5.33% -1.01% 0.7173% -6.92% -0.79% -2.70% -2.74% -2.69% -3.98% 3.06% 0.7480% 2.34% -6.49% -5.64% -4.93% -6.90% -5.77% -2.20% 0.7082% -2.09% -3.47% -5.46% -3.81% -4.65% -5.45% 0.58% 0.1981% -1.24% 8.68% 12.17% 8.99% 10.32% 5.54% 2.68% 0.2606% -2.10% -3.35% -3.17% -3.65% -2.31% -2.47% -1.79% 0.8143% -0.61% -3.82% -5.54% -2.90% -4.44% -3.03% -3.07% 0.6265% 0.05% 3. Refer to the "Regression worksheet. This worksheet contains (i) monthly returns of five risky assets (A, B, C, D, and E), (ii) monthly returns of the market index, (iii) monthly returns of the risk-free asset, and (iv) the month-to-month change in COVID-19 cases, expressed in percentage points. Based on the data provided, (a) [1 mark] Compute, in column H, the monthly returns of a portfolio that is equally weighted on the five risky assets. (b) [1 mark] Compute, in column K, the monthly excess returns of the above portfolio. (c) [1 mark] Compute, in column L, the monthly excess returns of the market index. Estimate the following regression models and paste the outputs precisely at the specified ranges in the worksheet. Outputs, even if they are correct, that are pasted at the wrong locations will receive zero credit. (d) (5 marks] Set output range to cell V4. Excess returns portfolio = a + B..% Change in COVID cases + e (e) [5 marks] Set output range to cell V27. Excess returnSportfolio = a + B1-% Change in COVID cases + B, . Excess returns market + Compute the root mean squared errors (RMSE) of your regression models. Show all computations in the worksheet clearly. Answers, even if they are correct, that are unac- companied by worksheet computations will receive zero credit. (f) [6 marks] What is the RMSE of the model in part (d)? (g) [6 marks] What is the RMSE of the model in part (e)? Excess Excess Portfolio Market % Change in Asset A Asset B Asset C Asset D Asset E Returns Returns returns Riskfree rate Returns Portfolio COVID Cases Market -5.52% -3.76% -3.75% -4.28% -4.099 -2.81% 0.8732% 65.79% 2.31% 3.60% 2.47% 1.21% 2.15% 4.22% 0.3631% 31.75% -5.67% -5.79% -4.91% -6.17% -6.04% -3.39% 0.3116% 78.31% -4.00% -3.48% -5.17% -3.04% -4.65% -1.71% 0.6993% 31.76% -14.70% -16.17% -13.55% -14.44% -12.43% -7.60% 0.5838% 204.62% 7.66% 8.20% 7.77% 6.39% 8.00% 4.94% 0.9301% 44.61% -3.98% -8.62% -4.71% -6.29% -7.84% -4.89% 0.7767% 30.03% -9.53% -14.83% -8.24% -12.70% -15.87% -9.51% 0.2548% 31.15% 17.80% 17.98% 18.01% 17.37% 13.57% 9.29% 0.3230% 15.02% -15.40% -19.30% -14.96% - 12.21% -14.21% -11.98% 0.4601% 112.40% 7.53% -2.28% 6.11% 3.53% 11.81% 6.00% 0.1695% 70.05% -5.41% -9.49% -10.53% -2.14% -5.10% -5.18% 1.0602% 51.61% 1.97% 8.81% 1.68% 0.64% 0.60% 0.47% 0.1778% 47.29% -7.22% -3.99% -2.11% -1.93% -6.33% -4.34% 0.7281% 24.00% -8.08% -7.02% -5.35% -11.18% -4.72% -2.93% 0.6456% 138.04% 16.32% 14.89% 11.89% 7.85% 14.53% 9.38% 1.0871% 18.24% 0.33% 2.95% 3.73% 2.66% 0.17% 1.15% 0.8463% 22.28% 7.68% 9.94% 6.97% 12.96% 6.66% 6.24% 1.0678% 20.93% -4.93% -4.82% -7.12% -1.13% -2.01% -3.37% 0.3277% 20.58% 2.04% 0.64% 2.60% 0.28% -1.19% 3.35% 0.4564% 40.94% -3.68% -4.45% -3.71% -3.96% -4.08% -1.60% 0.9101% 10.44% -6.88% -8.57% -6.30% -7.31% -7.42% -4.41% 0.7175% 9.92% 4.05% 1.87% 3.73% 2.32% 2.45% 2.28% 0.4594% 6.37% -2.63% -4.44% -3.95% -4.53% -3.64% -1.51% 1.0368% 10.98% 6.79% 9.68% 6.44% 10.20% 9.15% 7.03% 0.1486% 23.40% 3.51% 0.32% 1.32% 0.23% 0.49% -0.16% 0.4094% -0.46% 5.92% 7.30% 4.04% 3.48% 5.25% 3.41% 0.8035% 2.14% 6.01% 7.12% 8.97% 6.73% 9.64% 1.45% 0.5364% 2.60% -3.78% -1.54% -4.45% -3.31% -5.33% -1.01% 0.7173% -6.92% -0.79% -2.70% -2.74% -2.69% -3.98% 3.06% 0.7480% 2.34% -6.49% -5.64% -4.93% -6.90% -5.77% -2.20% 0.7082% -2.09% -3.47% -5.46% -3.81% -4.65% -5.45% 0.58% 0.1981% -1.24% 8.68% 12.17% 8.99% 10.32% 5.54% 2.68% 0.2606% -2.10% -3.35% -3.17% -3.65% -2.31% -2.47% -1.79% 0.8143% -0.61% -3.82% -5.54% -2.90% -4.44% -3.03% -3.07% 0.6265% 0.05%


