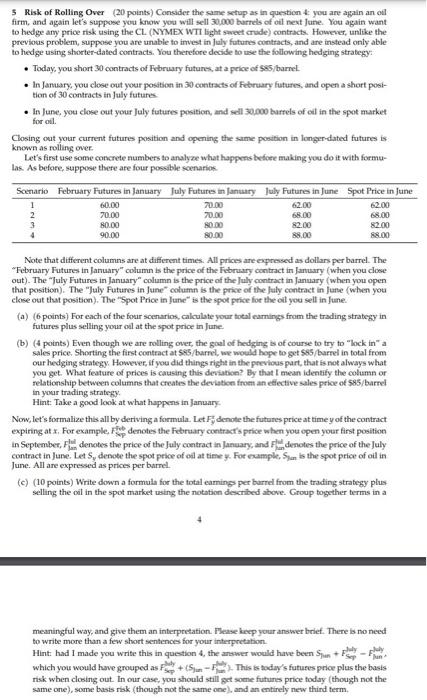
3 Risk of Rolling Over (20 points) Consider the same setup as in question 4 : you are again an of firm, and again let's suppose you know you will sell 30,000 burrels of oil next June. You again want to hedge any price risk using the CL. (NYMEX WTI light sweet crude) contracts. However, unlike the previous problem, suppose you are unable to imvest in july futures contracts, and are instead only able to hed ge using shorter-dated contracts. You therefore decide to use the following hedging strategy: - Today, you short 30 contracts of Fibruary futares, at a peice of $85/ barrel. - In January, you close out your posibion in 39 contracts of February futures, and open a short position of 30 contracts in july futures. - In June, you close out your July futures position, and sell 30,n00 barrels of ed in the spot market for od. Closing out your current futures position and opening the same position in longer-dated futures is known as rolling over. Let's first use some concrete numbers to analyze what happens befoee making you do if with formulas. As before, suppose there are four possible soenariof Note that different columns are at different times. All prices are expressed as dollars per barrel. The "February Futures in January" column is the price of the Fabruary contract in January (when you dose out). The "July Futures in January" column is the price of the luly contract in January (when you open that position). The "July Futures in June" column is the prise of the fully contract in furse (when you close out that position). The "Spot Price in June" is the spot price for the oil you self in June. (a) (6 points) For each of the four scenarios, calculate your tocal eamings from the trading strategy in futures plus selling your oil at the spot price in June. (b) (4 points) Even though we are rolling over, the goal of hedging is of course to try to "lock in" a sales price. Shorting the first contract at ses/barrel, we would hope to get 545 /barrel in total from our hedging strategy. Howerer, if you did things right in the previous part, that is not always what you get. What feature of prices is causing this deviatica? By that I mean identify the column or relationship between columns that creates the deviation from an efiectave sales price of 585/ barrel in your trading strategy: Hint: Take a good look at what happens in January. Now, let's formalize this all by deriving a formula. Let Fy denote the futures price at time y of the contract expiring at x. For example, F ise denotes the Fetruary contracr's price when you epen your finst position in September, Filal denotes the price of the July contract in January, and Fandenotes the price of the July contract in June. Let Sy denote the spot peice of od at time y. For nample, Slan ts the spot price of oil in June. All are expressed as prices per barrel. (c) (10 points) Write down a formula for the total eamings per barrel from the trading strategy plus selling the oil in the spot market using the notation described above. Group together terms in a 4 meaningful way, and give them an interpretation. Please keep your answer brief. There is no need to write more than a few short sentences for your interpretation. Hint: had 1 made you write this in question 4 , the answer would have been Slan+FS lay Fpunt, which you would have grouped as Fhepay+(SjanFlan). This is today's futures price plus the basis risk when closing out. In our case, you should still get same futurs price today (though not the same one), some basis riak (though not the same one), and an entirely new thind term. 3 Risk of Rolling Over (20 points) Consider the same setup as in question 4 : you are again an of firm, and again let's suppose you know you will sell 30,000 burrels of oil next June. You again want to hedge any price risk using the CL. (NYMEX WTI light sweet crude) contracts. However, unlike the previous problem, suppose you are unable to imvest in july futures contracts, and are instead only able to hed ge using shorter-dated contracts. You therefore decide to use the following hedging strategy: - Today, you short 30 contracts of Fibruary futares, at a peice of $85/ barrel. - In January, you close out your posibion in 39 contracts of February futures, and open a short position of 30 contracts in july futures. - In June, you close out your July futures position, and sell 30,n00 barrels of ed in the spot market for od. Closing out your current futures position and opening the same position in longer-dated futures is known as rolling over. Let's first use some concrete numbers to analyze what happens befoee making you do if with formulas. As before, suppose there are four possible soenariof Note that different columns are at different times. All prices are expressed as dollars per barrel. The "February Futures in January" column is the price of the Fabruary contract in January (when you dose out). The "July Futures in January" column is the price of the luly contract in January (when you open that position). The "July Futures in June" column is the prise of the fully contract in furse (when you close out that position). The "Spot Price in June" is the spot price for the oil you self in June. (a) (6 points) For each of the four scenarios, calculate your tocal eamings from the trading strategy in futures plus selling your oil at the spot price in June. (b) (4 points) Even though we are rolling over, the goal of hedging is of course to try to "lock in" a sales price. Shorting the first contract at ses/barrel, we would hope to get 545 /barrel in total from our hedging strategy. Howerer, if you did things right in the previous part, that is not always what you get. What feature of prices is causing this deviatica? By that I mean identify the column or relationship between columns that creates the deviation from an efiectave sales price of 585/ barrel in your trading strategy: Hint: Take a good look at what happens in January. Now, let's formalize this all by deriving a formula. Let Fy denote the futures price at time y of the contract expiring at x. For example, F ise denotes the Fetruary contracr's price when you epen your finst position in September, Filal denotes the price of the July contract in January, and Fandenotes the price of the July contract in June. Let Sy denote the spot peice of od at time y. For nample, Slan ts the spot price of oil in June. All are expressed as prices per barrel. (c) (10 points) Write down a formula for the total eamings per barrel from the trading strategy plus selling the oil in the spot market using the notation described above. Group together terms in a 4 meaningful way, and give them an interpretation. Please keep your answer brief. There is no need to write more than a few short sentences for your interpretation. Hint: had 1 made you write this in question 4 , the answer would have been Slan+FS lay Fpunt, which you would have grouped as Fhepay+(SjanFlan). This is today's futures price plus the basis risk when closing out. In our case, you should still get same futurs price today (though not the same one), some basis riak (though not the same one), and an entirely new thind term