

Question
3. Statistical measures of standalone risk Remember, the expected value of a probability distribution is a statistical measure of the average (mean) value expected to
3. Statistical measures of standalone risk
Remember, the expected value of a probability distribution is a statistical measure of the average (mean) value expected to occur during all possible circumstances. To compute an assets expected return under a range of possible circumstances (or states of nature), multiply the anticipated return expected to result during each state of nature by its probability of occurrence.
Consider the following case:
Neha owns a two-stock portfolio that invests in Celestial Crane Cosmetics Company (CCC) and Lumbering Ox Truckmakers (LOT). Three-quarters of Nehas portfolio value consists of Celestial Crane Cosmeticss shares, and the balance consists of Lumbering Ox Truckmakerss shares.
Each stocks expected return for the next year will depend on forecasted market conditions. The expected returns from the stocks in different market conditions are detailed in the following table:
| Market Condition | Probability of | CCC | LOT |
|---|---|---|---|
| Occurrence | |||
| Strong | 20% | 50% | 70% |
| Normal | 35% | 30% | 40% |
| Weak | 45% | -40% | -50% |
Calculate expected returns for the individual stocks in Nehas portfolio as well as the expected rate of return of the entire portfolio over the three possible market conditions next year.
| The expected rate of return on Celestial Crane Cosmeticss stock over the next year is (3%, 2.5%, 3.38%, OR 2.13%). | |
| The expected rate of return on Lumbering Ox Truckmakerss stock over the next year is (6.22%, 6.82%, 5.5%, OR 3.58%). | |
| The expected rate of return on Nehas portfolio over the next year is (4.39%, 3.25%, 3.90%, OR 2.76%). |
The expected returns for Nehas portfolio were calculated based on three possible conditions in the market. Such conditions will vary from time to time, and for each condition there will be a specific outcome. These probabilities and outcomes can be represented in the form of a continuous probability distribution graph.
For example, the continuous probability distributions of rates of return on stocks for two different companies are shown on the following graph:
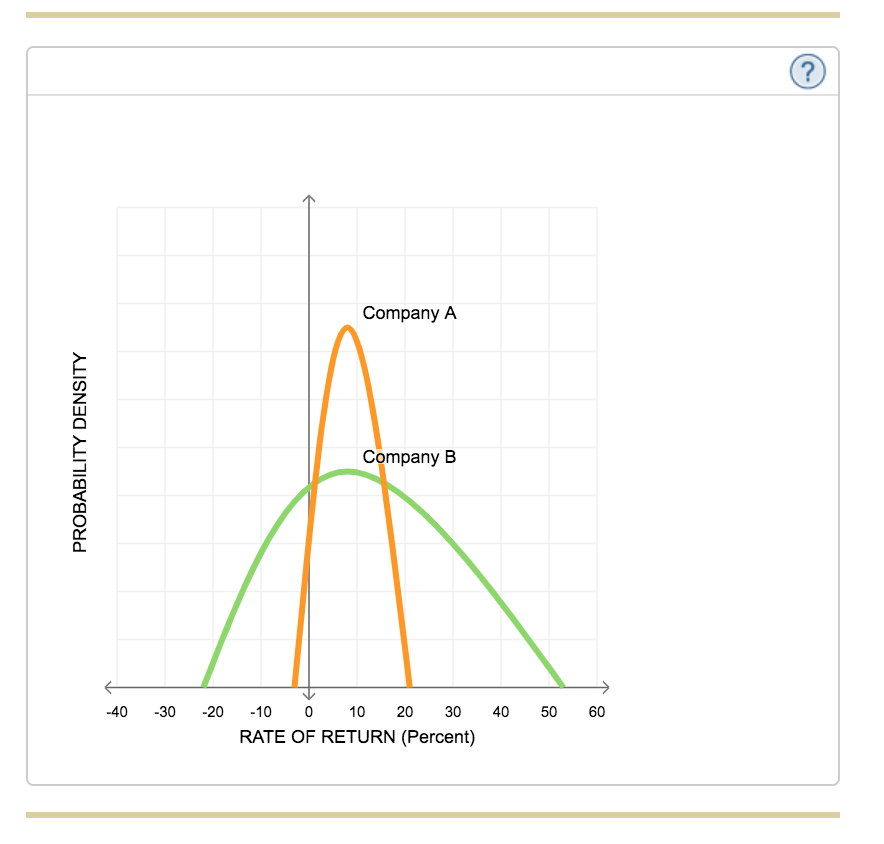
Based on the graphs information, which of the following statements is true?
A. Company A has a smaller standard deviation.
B. Company B has a smaller standard deviation.
Company A Company B 40 -30 20 10 0 10 20 30 40 50 60 RATE OF RETURN (Percent)Step by Step Solution
There are 3 Steps involved in it
Step: 1

Get Instant Access to Expert-Tailored Solutions
See step-by-step solutions with expert insights and AI powered tools for academic success
Step: 2

Step: 3
Ace Your Homework with AI
Get the answers you need in no time with our AI-driven, step-by-step assistance
Get Started
Financial Management For Nonprofit Organizations Policies And Practices
Authors: Jo Ann Hankin, John Zietlow, Alan Seidner, Tim O'Brien
3rd Edition
1119382564, 9781119382560