Answered step by step
Verified Expert Solution
Question
1 Approved Answer
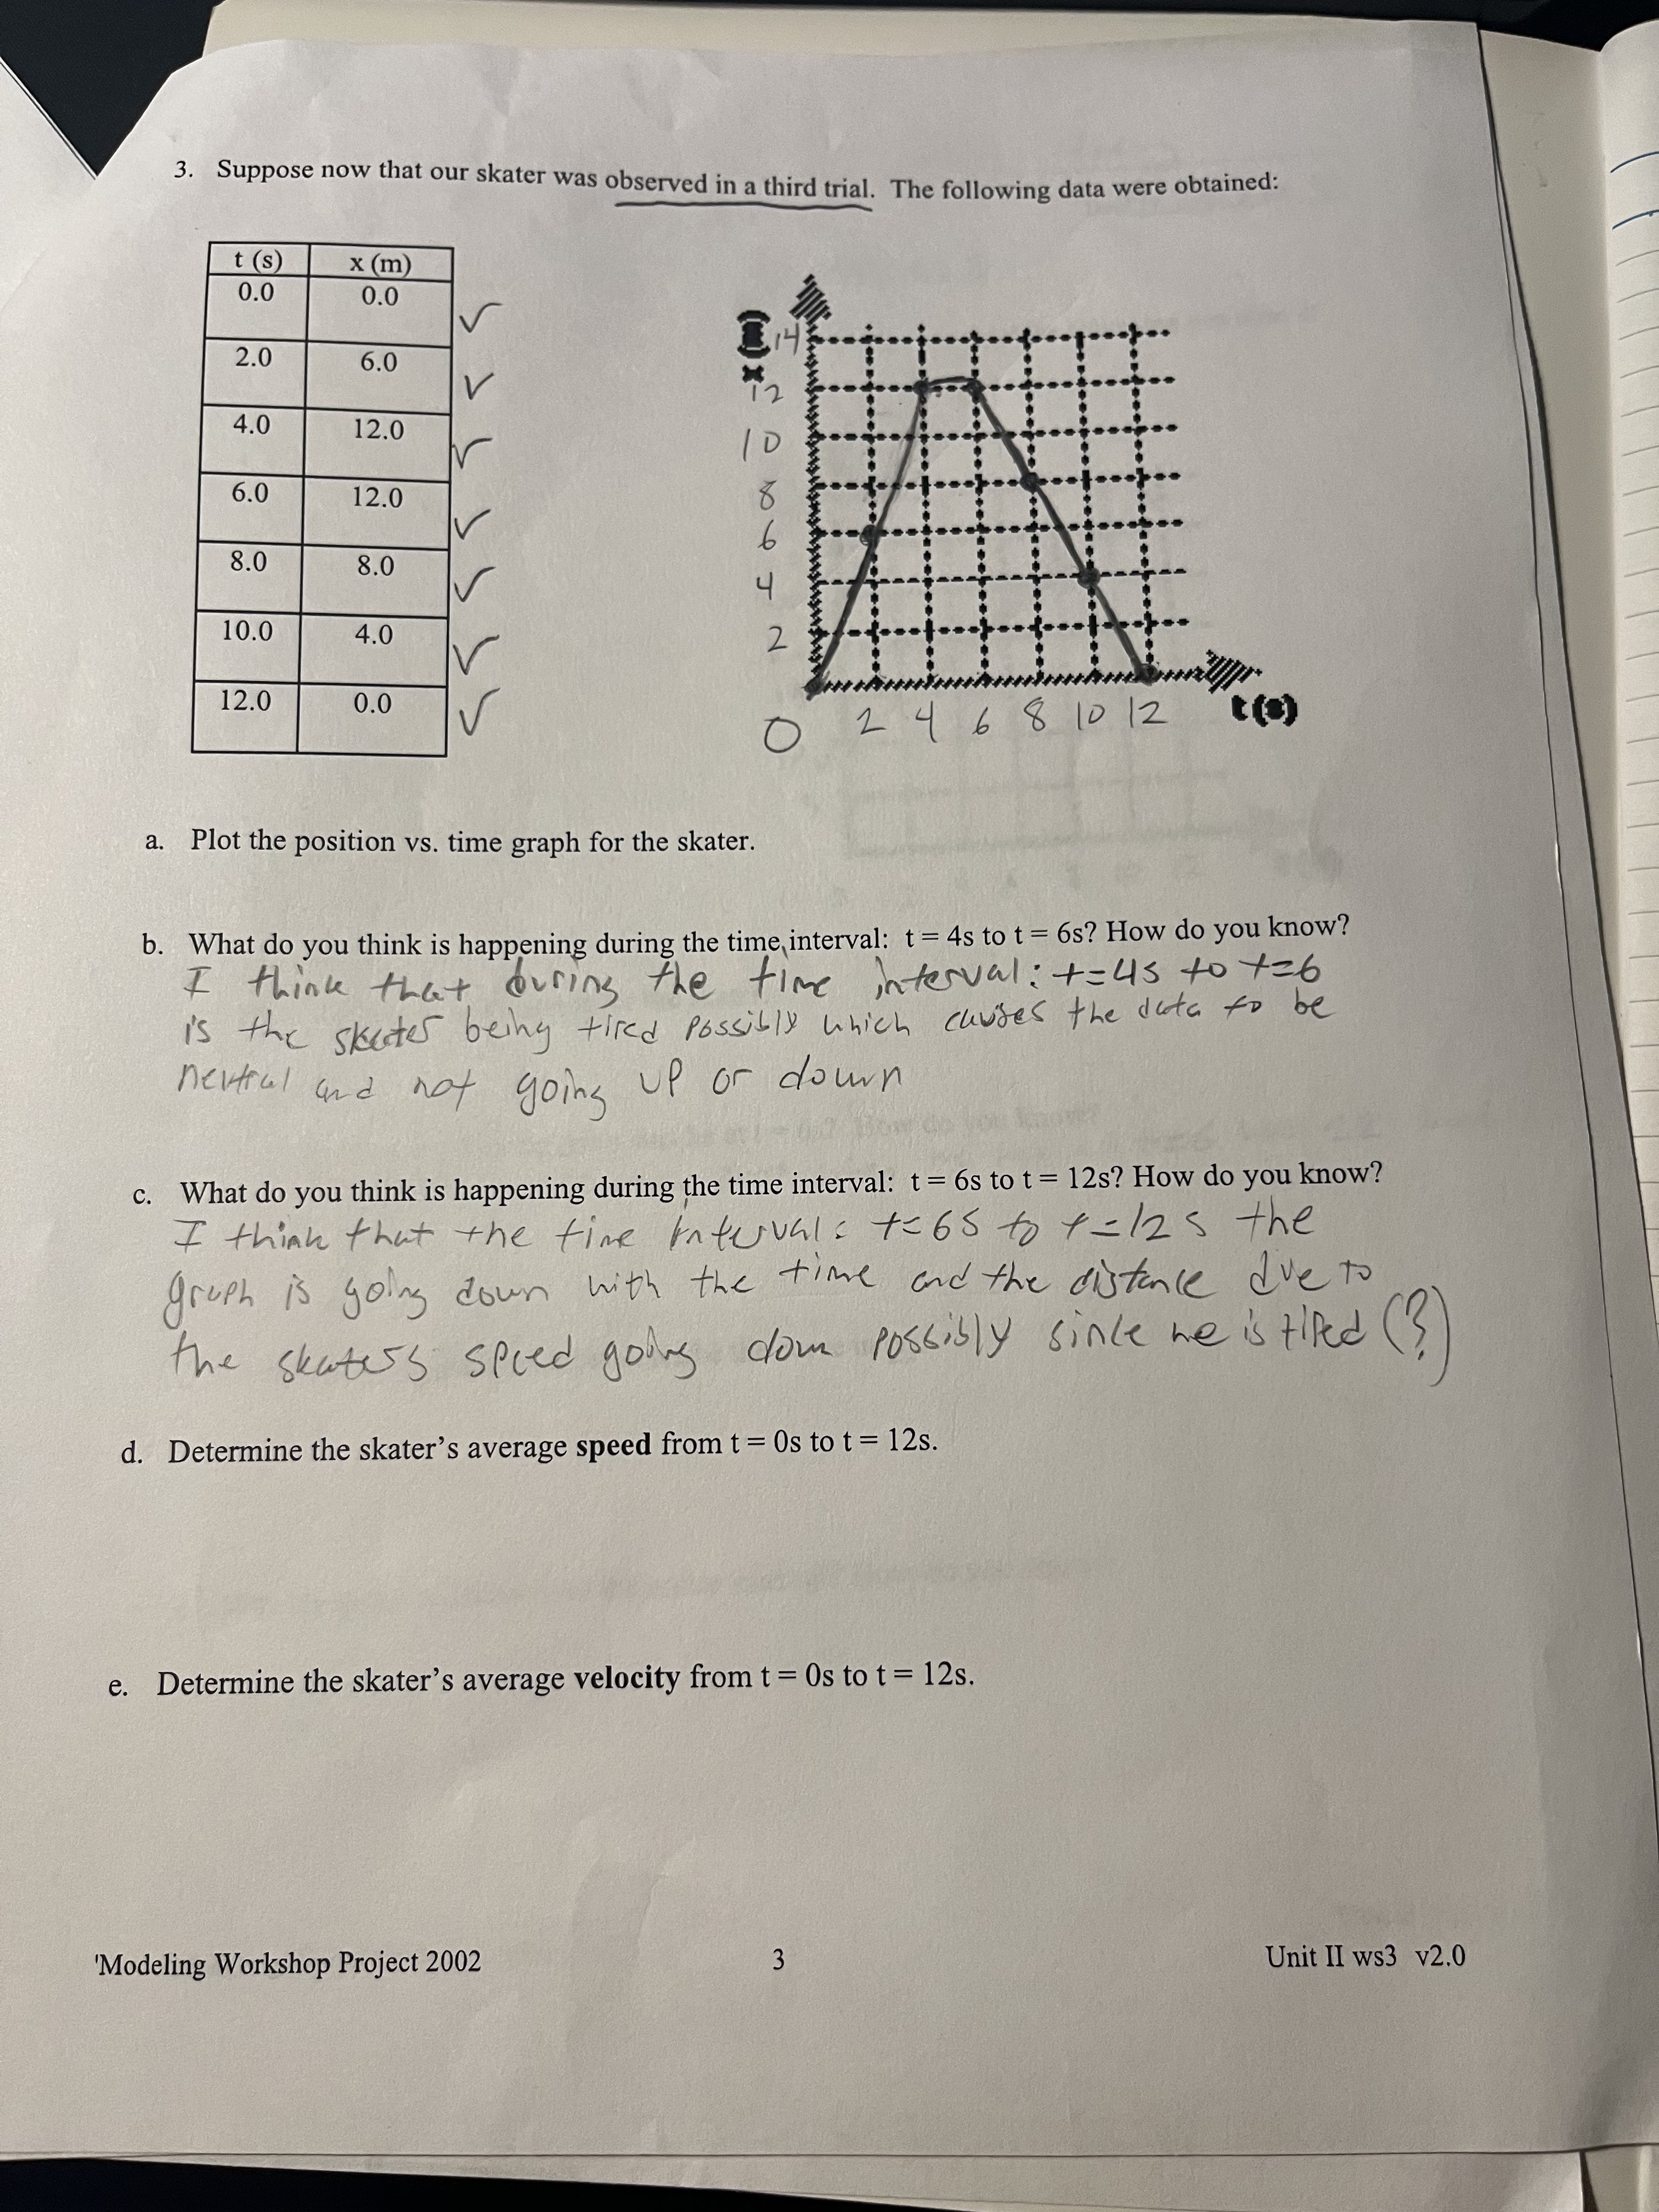
3. Suppose now that our skater was observed in a third trial. The following data were obtained: t (s) x (m) 0.0 0.0 2.0


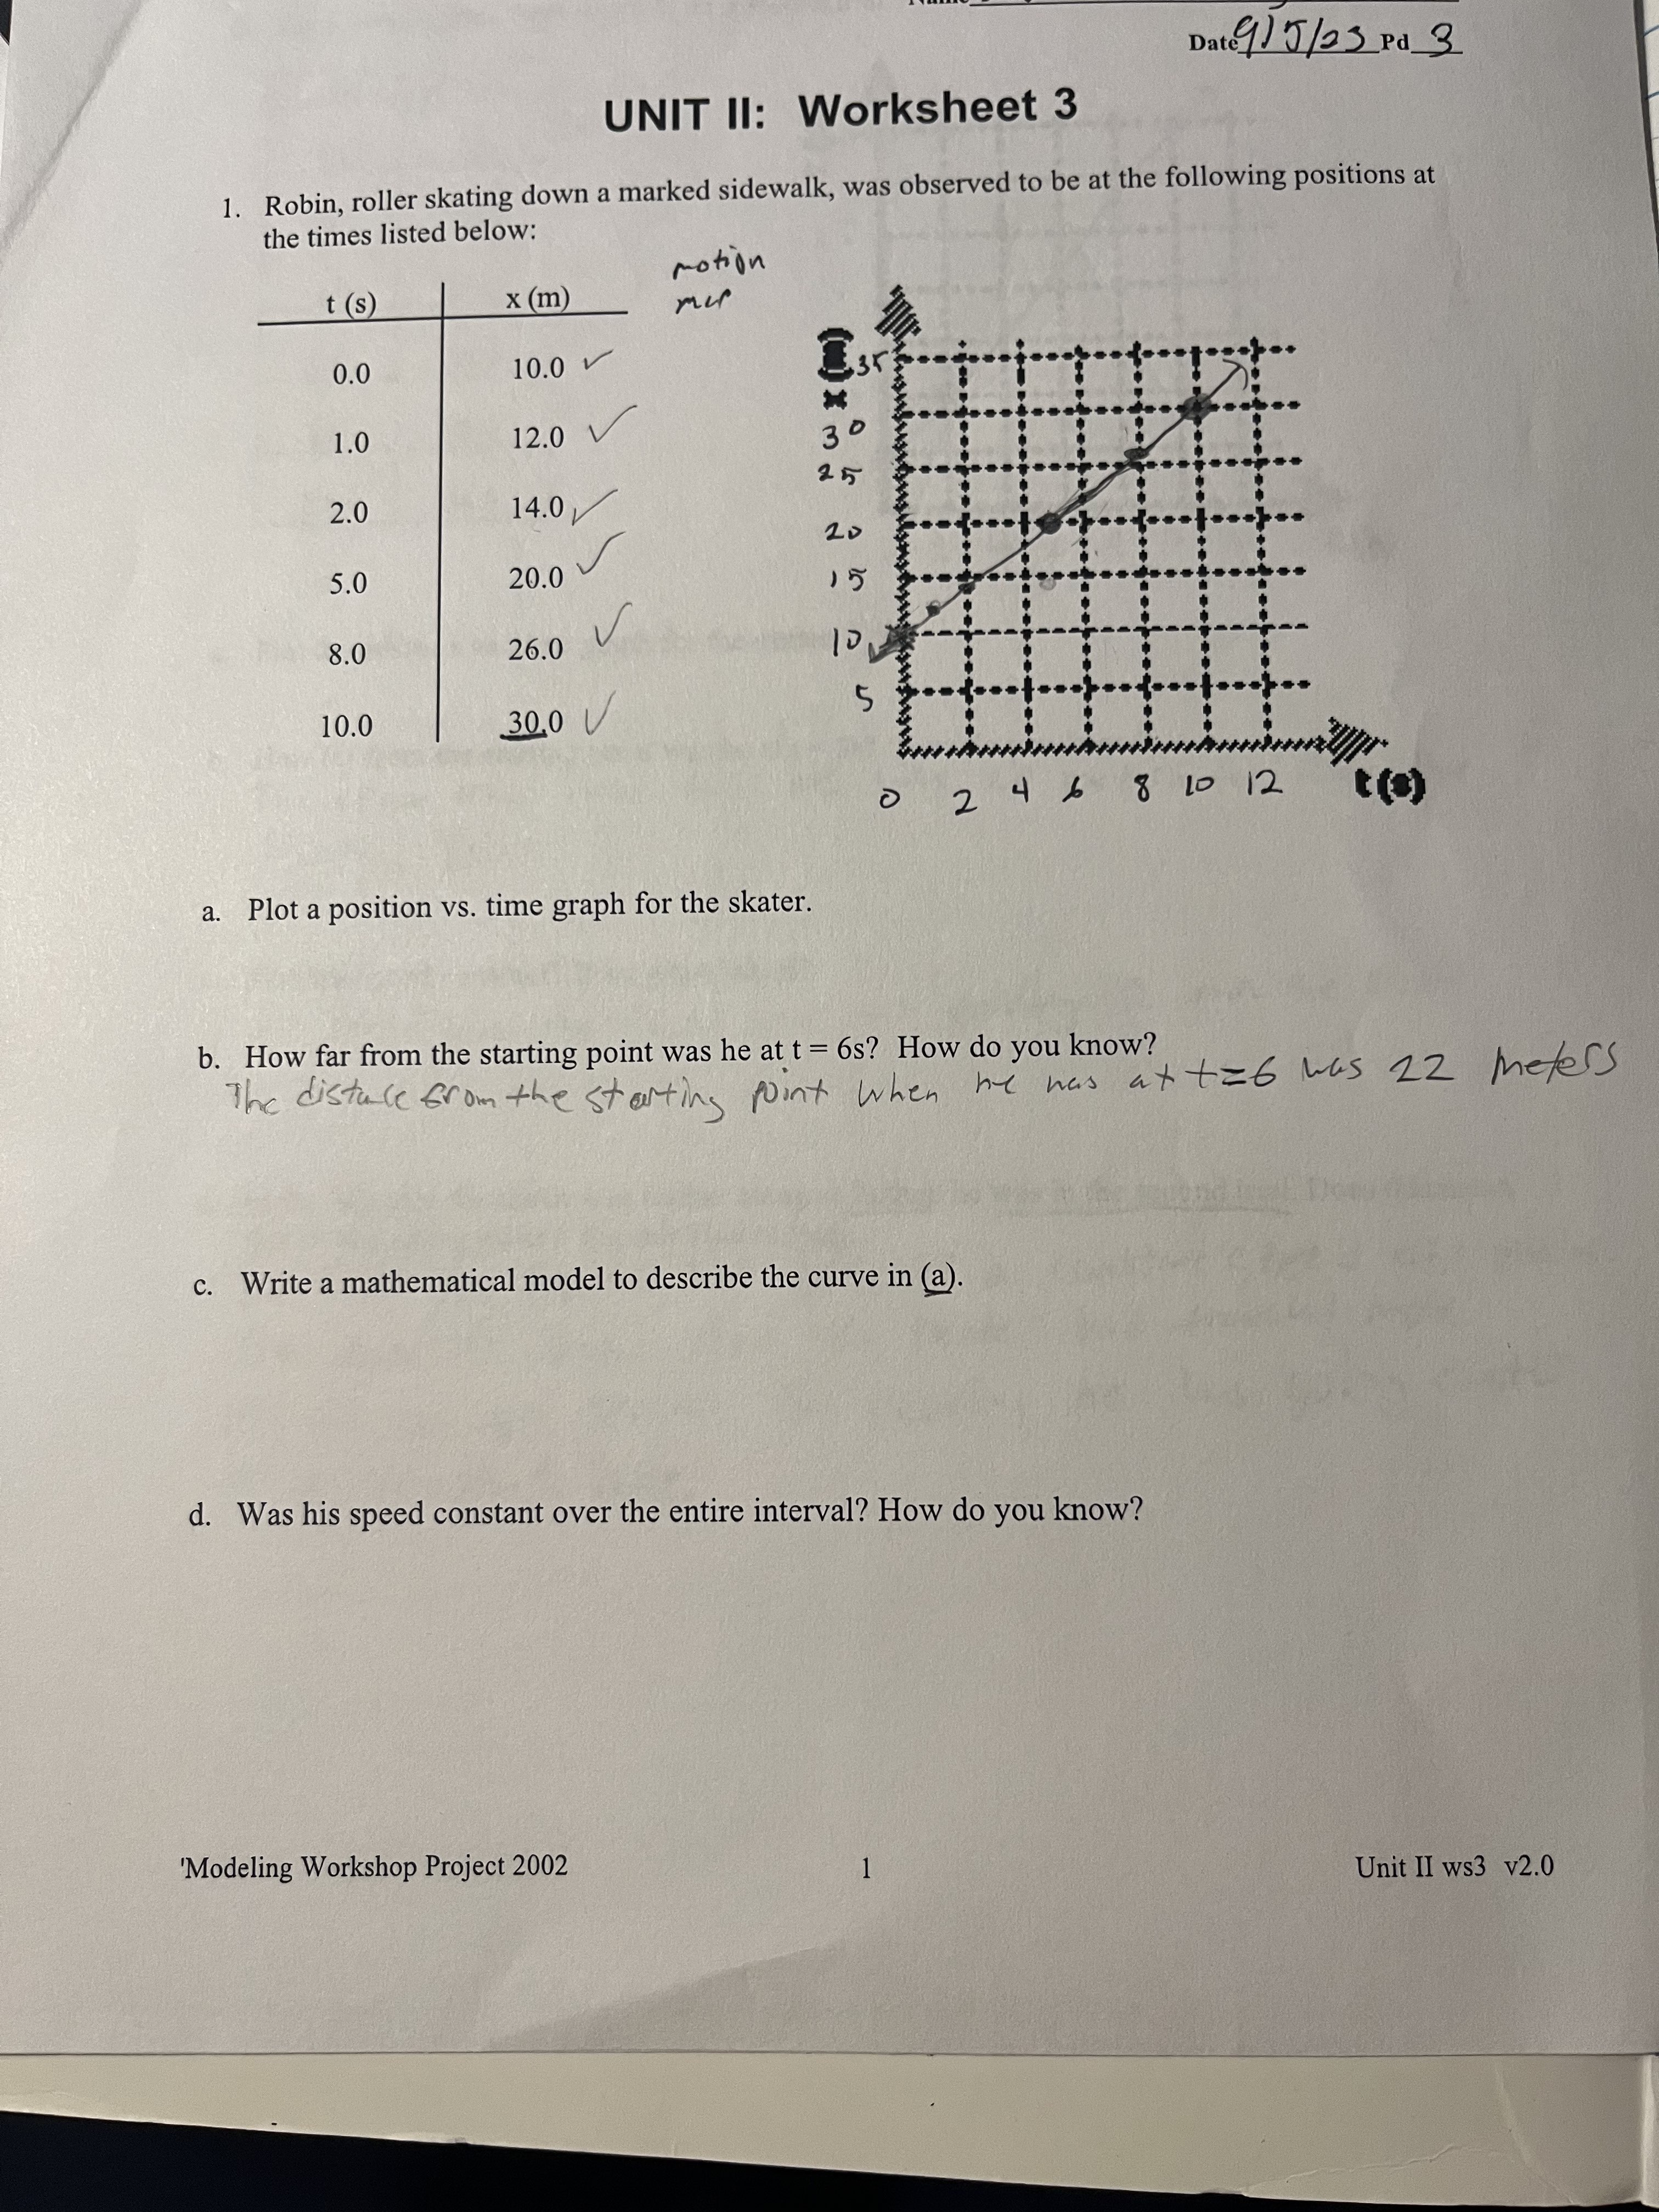
3. Suppose now that our skater was observed in a third trial. The following data were obtained: t (s) x (m) 0.0 0.0 2.0 6.0 V 4.0 12.0 6.0 12.0 8 6 8.0 8.0 10.0 4.0 2 12.0 0.0 02 4 6 8 10 12 t(s) a. Plot the position vs. time graph for the skater. you know? b. What do you think is happening during the time, interval: t = 4s to t = 6s? How do I think that during the time interval: += 45 to +26 is the skater being tired Possibly which causes the data to be nevtral and not going up or down c. What do you think is happening during the time interval: t = 6s to t = 12s? How do you know? I think that the time interval: += 65 to += 125 the gruph is going down with the time and the distance dive to the skater's speed going clome possibly since he is tiled (?) d. Determine the skater's average speed from t = 0s to t = 12s. e. Determine the skater's average velocity from t = 0s to t = 12s. 'Modeling Workshop Project 2002 3 Unit II ws3 v2.0 Date 9/5/23 Pd 3 UNIT II: Worksheet 3 1. Robin, roller skating down a marked sidewalk, was observed to be at the following positions at the times listed below: motion mer t (s) x (m) 0.0 10.0 (m) 1.0 12.0 V 30 25 2.0 14.0 20 5.0 20.0 15 8.0 26.0 10.0 30.0 V 5 a. Plot a position vs. time graph for the skater. 2 4 6 8 10 12 t(s) b. How far from the starting point was he at t = 6s? How do you know? The disture from the starting point when he was at +=6 was 22 meters c. Write a mathematical model to describe the curve in (a). d. Was his speed constant over the entire interval? How do you know? 'Modeling Workshop Project 2002 1 Unit II ws3 v2.0
Step by Step Solution
There are 3 Steps involved in it
Step: 1

Get Instant Access to Expert-Tailored Solutions
See step-by-step solutions with expert insights and AI powered tools for academic success
Step: 2

Step: 3

Ace Your Homework with AI
Get the answers you need in no time with our AI-driven, step-by-step assistance
Get Started


